Fig. 2
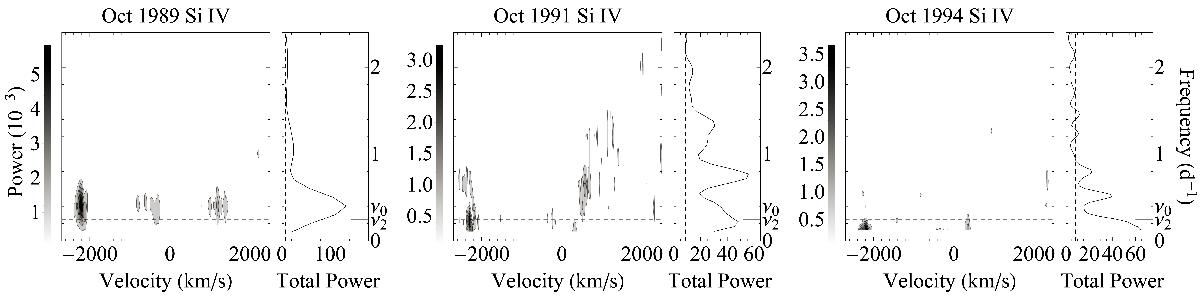
From left to right: grayscale representation of the CLEANed periodograms as a function of velocity in the stellar rest frame around the Si iv λ1394 line for the IUE datasets of October 1989, 1991, and 1994. The profiles of the 1994 data are shown in Fig. 1. The legend bars give the corresponding grayscale codings. The horizontal dashed line and tickmark at ν2 = 0.245 d-1 indicate our adopted rotation frequency of the star. The three side panels display the total power over the velocity range of the main panel in the same units. The vertical dashed line indicates the estimated noise level in the power (see text). The tickmark at ν0 = 0.403 d-1 (2.48 d) shows the dominant frequency in the 1989 data.
Current usage metrics show cumulative count of Article Views (full-text article views including HTML views, PDF and ePub downloads, according to the available data) and Abstracts Views on Vision4Press platform.
Data correspond to usage on the plateform after 2015. The current usage metrics is available 48-96 hours after online publication and is updated daily on week days.
Initial download of the metrics may take a while.