Fig. A.1
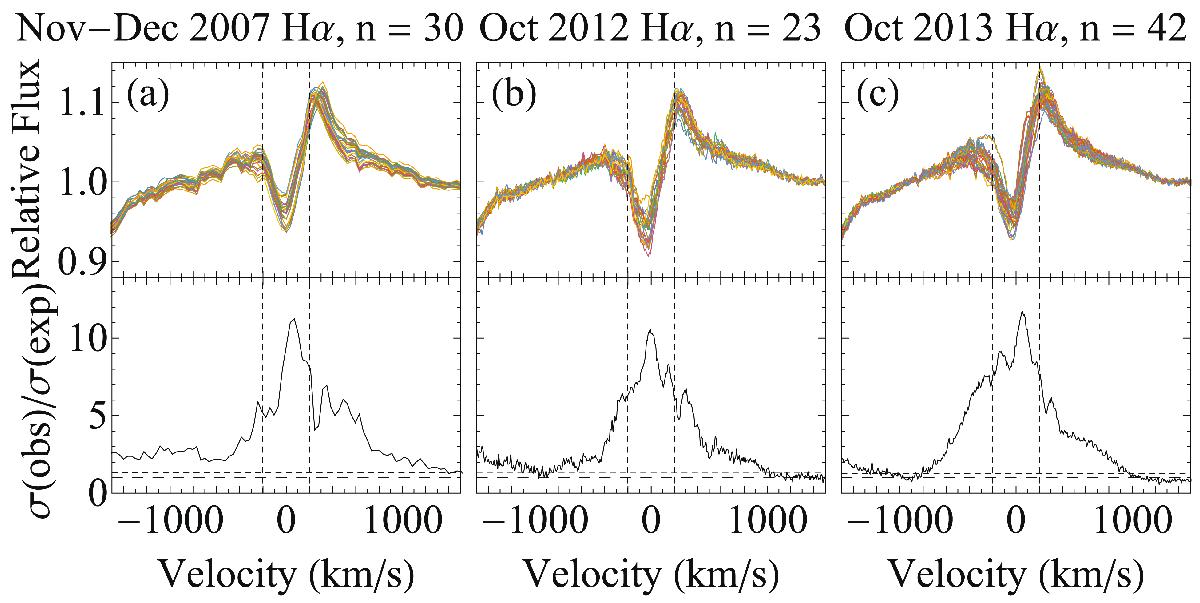
Top panels: overplotted Hαλ6563 spectra with n the number of spectra, which is the same for each panel in Figs. A.2−A.8. Vertical dashed lines are drawn at ± vsini. Lower panels: temporal variance spectra expressed as the ratio of the observed to the expected standard deviation, σobs/σexp. The lower horizontal long-dashed line is drawn at unity. The upper horizontal short-dashed line is the 1% significance level. From left to right: a) acquired at BOAO in 2007, spanning 27 days. b) acquired at the Mercator telescope in 2012, spanning 6 days. c) acquired at the Mercator telescope in 2013 spanning 6 days. The spectra in the panels have been rebinned to a velocity grid giving the same S/N of 560 per bin.
Current usage metrics show cumulative count of Article Views (full-text article views including HTML views, PDF and ePub downloads, according to the available data) and Abstracts Views on Vision4Press platform.
Data correspond to usage on the plateform after 2015. The current usage metrics is available 48-96 hours after online publication and is updated daily on week days.
Initial download of the metrics may take a while.