Fig. 10
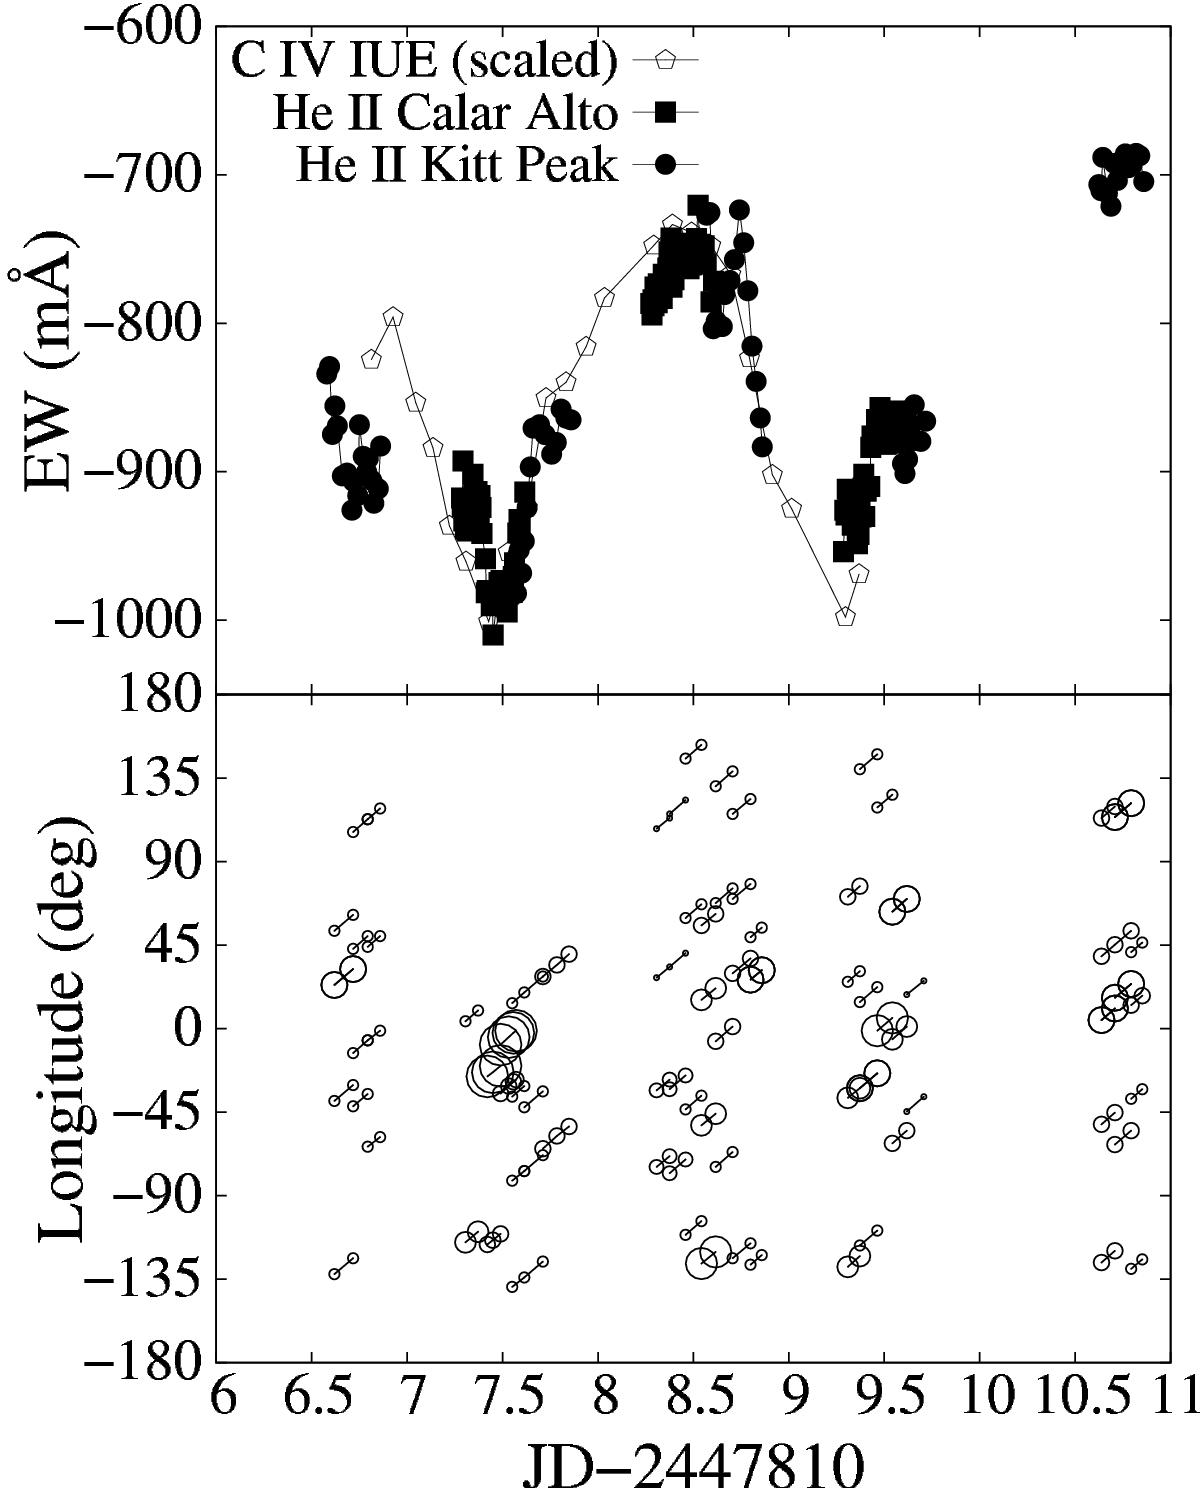
Equivalent width of the He ii λ4686 line in 1989 and simultaneous C iv blue edge wind variability (top, taken from Henrichs 1991) plotted along with the derived properties of the blobs with the symbol size proportional to the optical thickness (bottom). The vertical axis denotes the longitude of each blob as derived from the fits. The length of the connecting solid lines indicates the lifetime of the blobs. The linear trend is caused by the rotation.
Current usage metrics show cumulative count of Article Views (full-text article views including HTML views, PDF and ePub downloads, according to the available data) and Abstracts Views on Vision4Press platform.
Data correspond to usage on the plateform after 2015. The current usage metrics is available 48-96 hours after online publication and is updated daily on week days.
Initial download of the metrics may take a while.