Fig. 1
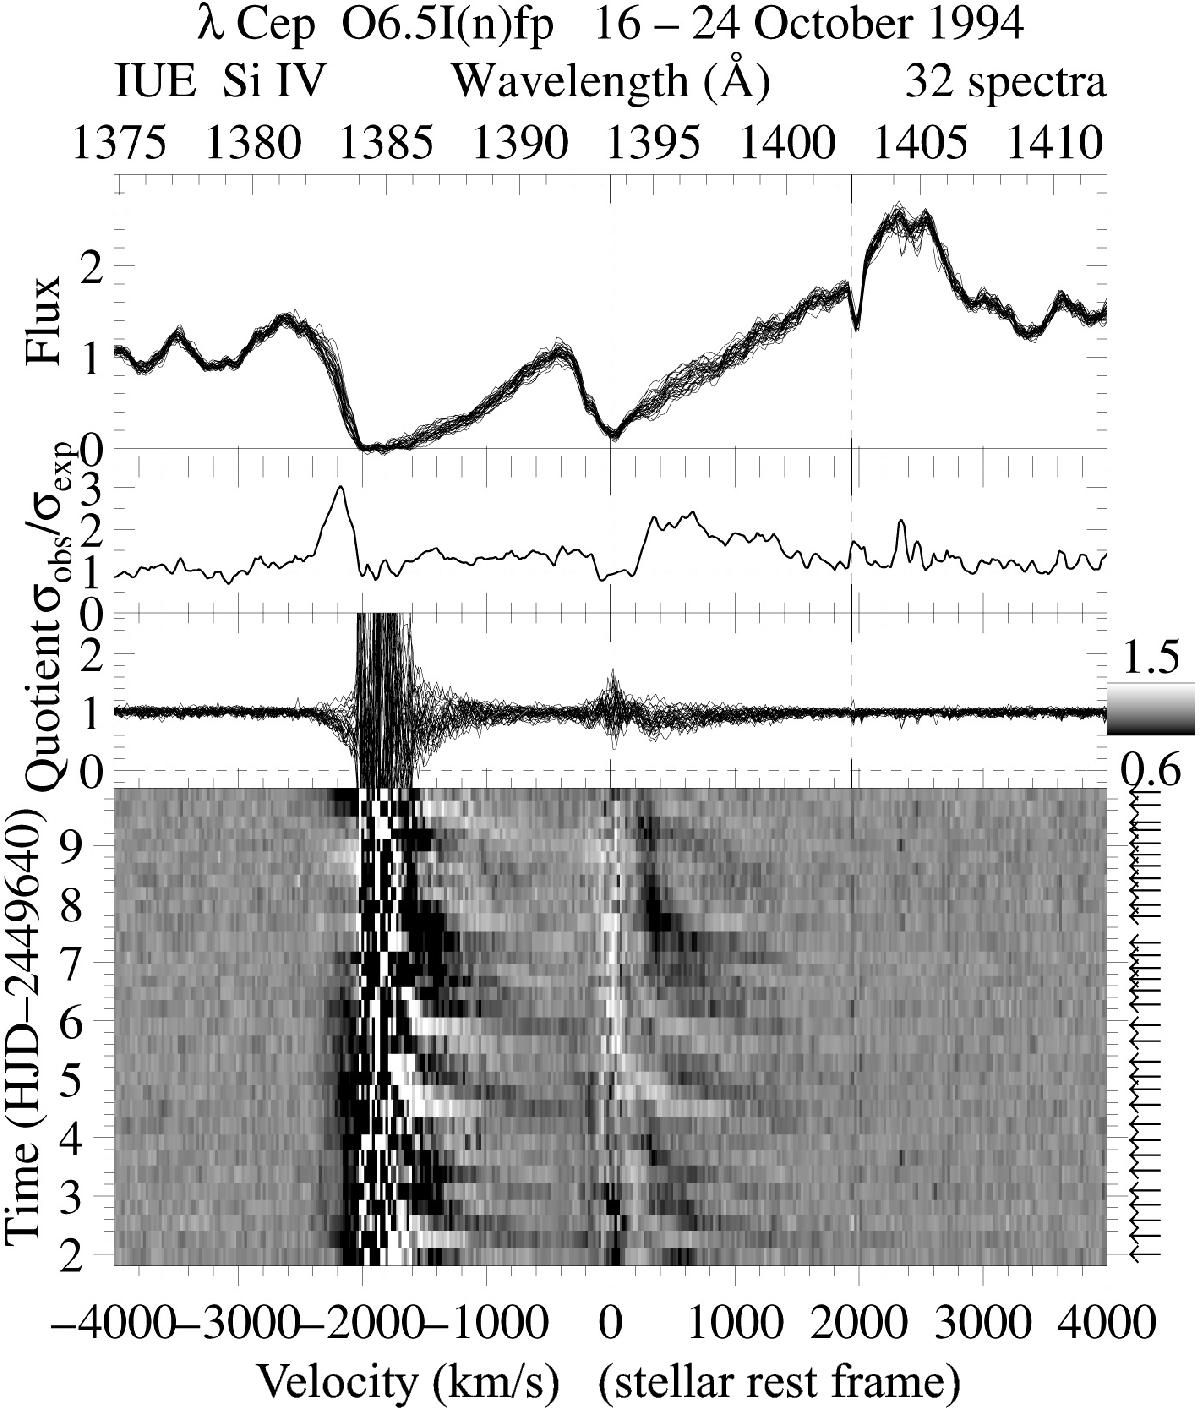
Variability in the Si iv λ1394–λ1403 doublet of λ Cep in October 1994 showing the cyclic appearance of DACs. Vertical dotted lines denote the rest wavelengths. Lower panel: Grayscale representation of quotient spectra in the panel above it, obtained with a template spectrum constructed from the spectra in the top panel (flux units in 10-10 erg cm-2 s-1 Å-1) using the method by Kaper et al. (1999). The template represents the undisturbed, underlying wind profile, which makes the DACs appear as absorption features. The second panel from the top gives the temporal variance spectrum (TVS1/2) expressed as the ratio of the observed to the expected standard deviation (see Sect. 4).
Current usage metrics show cumulative count of Article Views (full-text article views including HTML views, PDF and ePub downloads, according to the available data) and Abstracts Views on Vision4Press platform.
Data correspond to usage on the plateform after 2015. The current usage metrics is available 48-96 hours after online publication and is updated daily on week days.
Initial download of the metrics may take a while.