Fig. 7
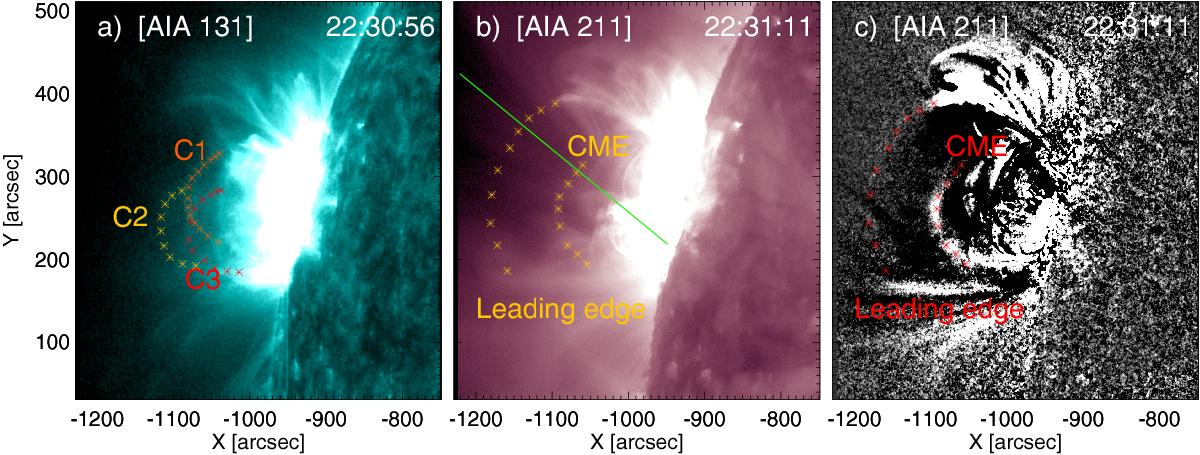
Panel a): a 131 Å image showing three separate components of the expanding CME labelled as C1, C2 and C3. Panels b) and c): 211 Å images with the CME and the leading edge which precedes it indicated in orange in panel b) and red in the difference image in panel c). The solid green line in panel b) indicates the position of the slit used to analyse the expanding feature ahead of the CME.
Current usage metrics show cumulative count of Article Views (full-text article views including HTML views, PDF and ePub downloads, according to the available data) and Abstracts Views on Vision4Press platform.
Data correspond to usage on the plateform after 2015. The current usage metrics is available 48-96 hours after online publication and is updated daily on week days.
Initial download of the metrics may take a while.