Fig. 2
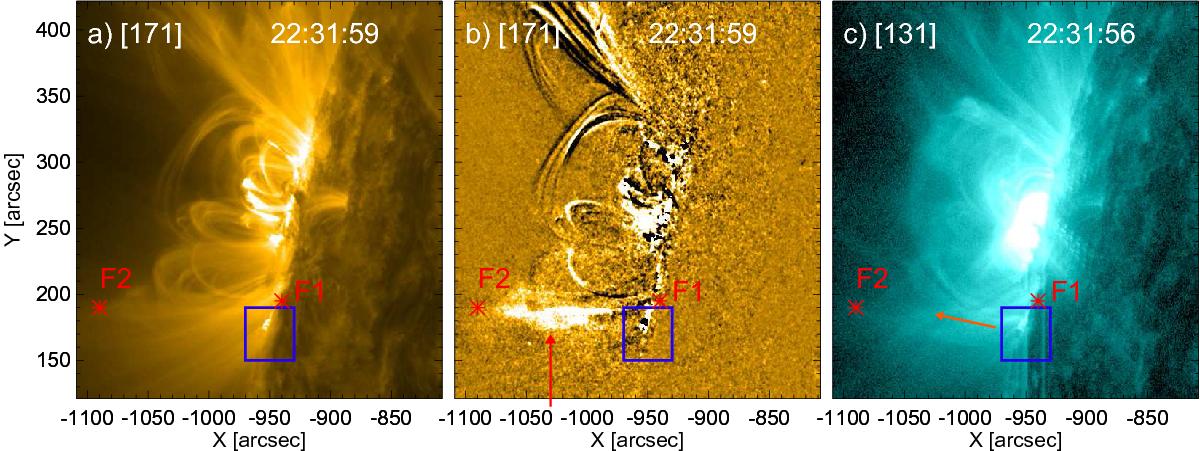
Three SDO/AIA images of the active region. In all panels the region of enhanced emission, associated with the ejection of the EUV wave-train, is highlighted by a blue box. The red points F1 and F2 indicate the start and end points of a guiding funnel structure. Panel a) shows the 171 Å image. Panel b) also shows a 171 image, with the previous frame subtracted. The red arrow indicates an enhancement propagating along the funnel. Panel c) shows a 131 Å image, the orange arrow indicates the direction of a propagating outflow. The time evolution is shown in the movie available online.
Current usage metrics show cumulative count of Article Views (full-text article views including HTML views, PDF and ePub downloads, according to the available data) and Abstracts Views on Vision4Press platform.
Data correspond to usage on the plateform after 2015. The current usage metrics is available 48-96 hours after online publication and is updated daily on week days.
Initial download of the metrics may take a while.