Fig. 8
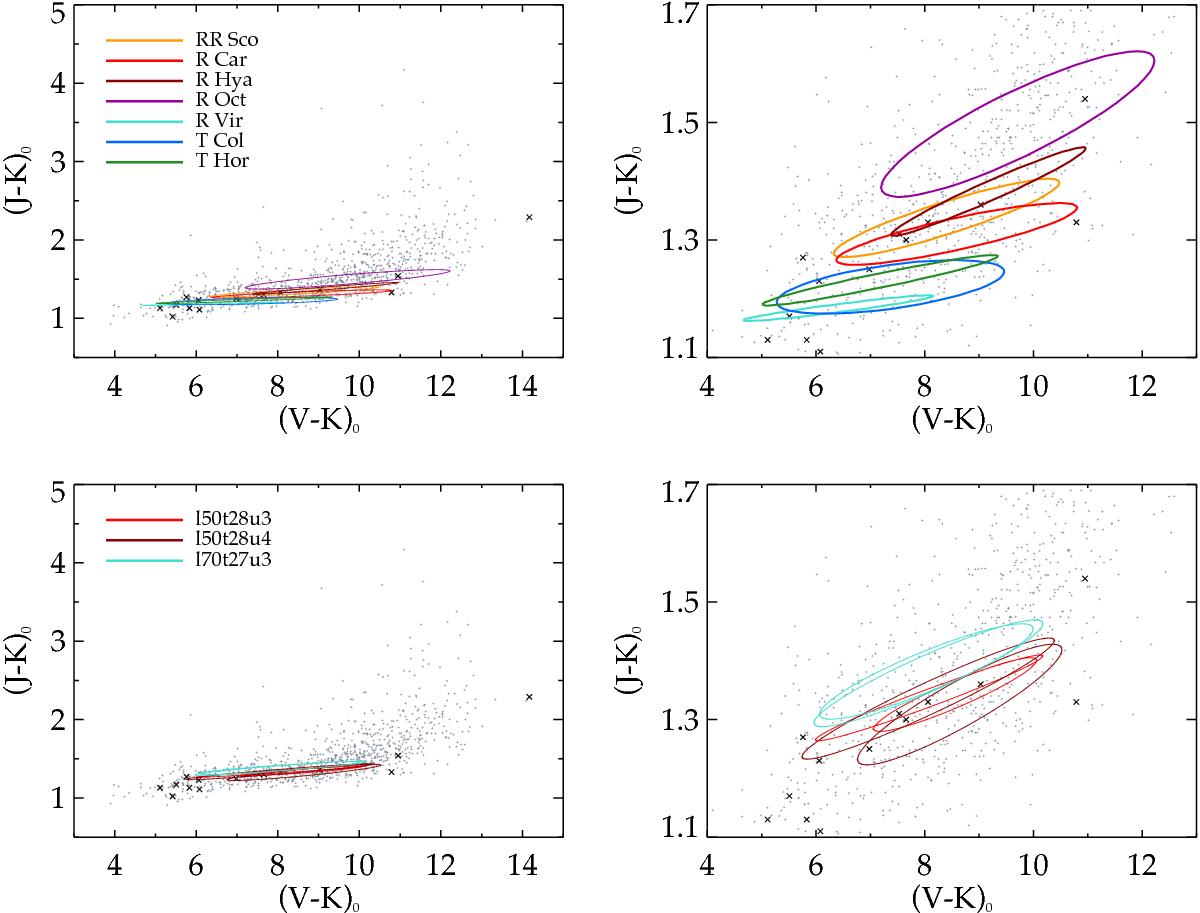
Observed and synthetic photometric variations of M-type AGB stars. Upper panels: photometric variations for a sample of observed targets, derived from sine fits of light-curves (see Fig. 4 and related text for details). Lower panels: photometric variations for the core-mantle grain models listed in Table 4 with colors calculated from sine fits of the light-curves, same as for the observational data in the top panels; the lines are color-coded by stellar parameters and pulsation amplitude.
Current usage metrics show cumulative count of Article Views (full-text article views including HTML views, PDF and ePub downloads, according to the available data) and Abstracts Views on Vision4Press platform.
Data correspond to usage on the plateform after 2015. The current usage metrics is available 48-96 hours after online publication and is updated daily on week days.
Initial download of the metrics may take a while.