Fig. 4
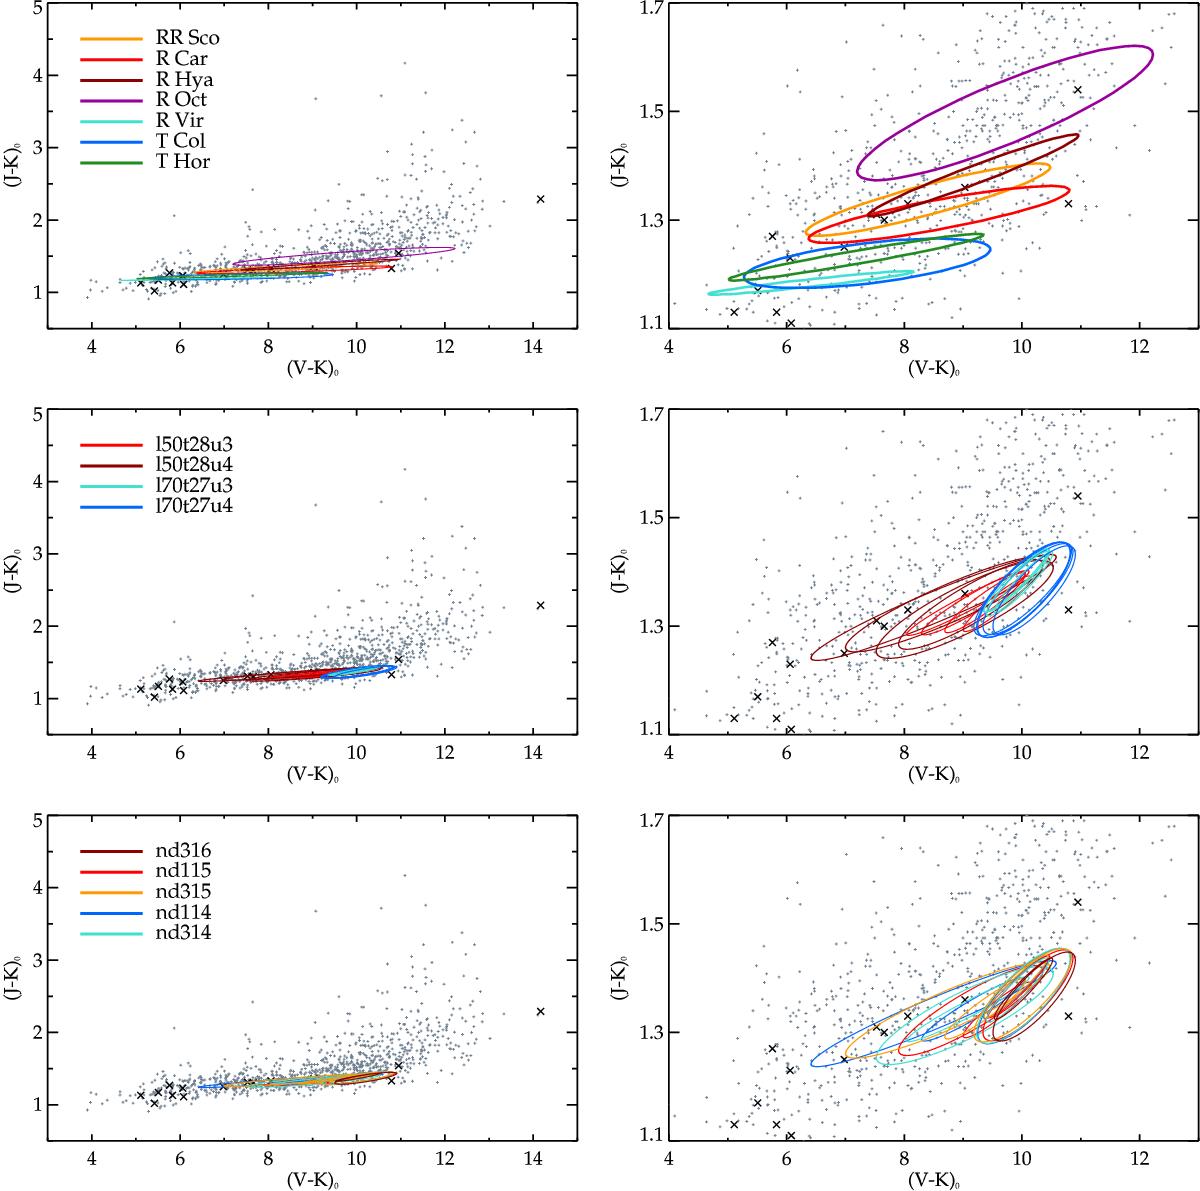
Observed and synthetic photometric variations of M-type AGB stars. Top panels: photometric variations for a sample of observed targets, derived from sine fits of light-curves; near-infrared data by Whitelock et al. (2000) has been combined with visual data by Eggen (1975) and Mendoza (1967); see Bladh et al. (2013) for details. Middle panels: photometric variations of the DARWIN models listed in Table 1 with colors calculated from sine fits of the light-curves, same as for the observational data in the top panels; the lines are color-coded by stellar parameters (l50t28 = A, l70t27 = B) and pulsation amplitude (u3/u4). Bottom panels: the same model results, but color-coded by seed particle abundance (nd316 stands for 3 × 10-16, nd115 for 1 × 10-15, etc.). The right panels show the same content as the left panels, zoomed in and centered on the color loops. The single-epoch photometric data shown in the background of all panels represents Galactic Bulge miras (Groenewegen & Blommaert 2005, gray plus signs) and field M-type long-period variables (Mendoza 1967, black crosses).
Current usage metrics show cumulative count of Article Views (full-text article views including HTML views, PDF and ePub downloads, according to the available data) and Abstracts Views on Vision4Press platform.
Data correspond to usage on the plateform after 2015. The current usage metrics is available 48-96 hours after online publication and is updated daily on week days.
Initial download of the metrics may take a while.