Fig. 7
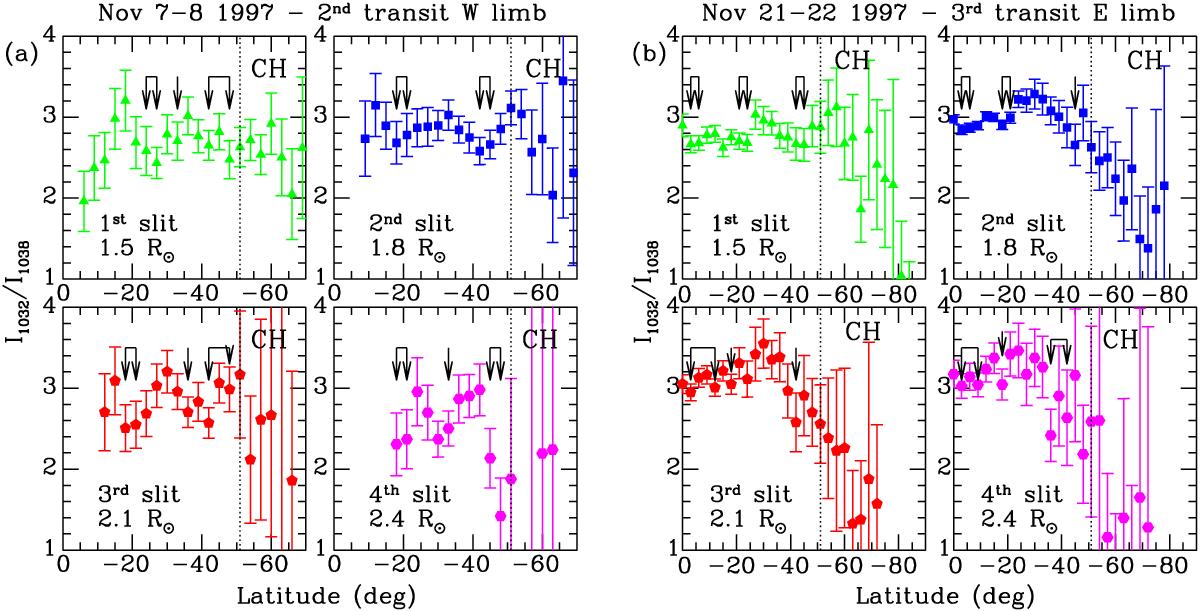
Profiles of the O vi doublet intensity ratio along the UVCS slit at four slit positions from data taken at PA = 225 deg (panel a)), and PA = 135 deg and PA = 90 deg (panel b)) for the second and third limb transit, respectively. The positions of the AR outflows are shown by arrows, and the vertical dotted line defines the boundary with the south polar CH.
Current usage metrics show cumulative count of Article Views (full-text article views including HTML views, PDF and ePub downloads, according to the available data) and Abstracts Views on Vision4Press platform.
Data correspond to usage on the plateform after 2015. The current usage metrics is available 48-96 hours after online publication and is updated daily on week days.
Initial download of the metrics may take a while.