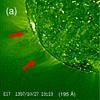
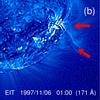
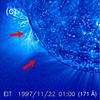
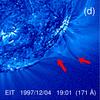
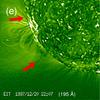
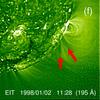
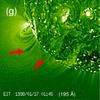
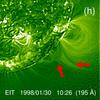
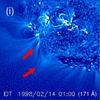
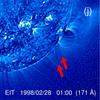
Fig. 6

EIT 171 Å and 195 Å wavelet-enhanced images, acquired during the AR limb transits. In the panels the red arrows point to weak emission regions, which we identify as the low corona counterparts of the low- and intermediate-latitude outflow channels that we infer from the DD analysis of UVCS data. We considered EIT 195 Å images when the 171 Å channel data were not available. For the second limb transit (panel b), we had to consider images taken on November 6 because no EIT data were available for November 7 and 8.
Current usage metrics show cumulative count of Article Views (full-text article views including HTML views, PDF and ePub downloads, according to the available data) and Abstracts Views on Vision4Press platform.
Data correspond to usage on the plateform after 2015. The current usage metrics is available 48-96 hours after online publication and is updated daily on week days.
Initial download of the metrics may take a while.