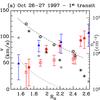
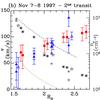
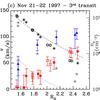
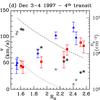
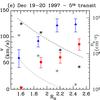
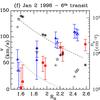
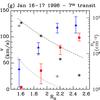
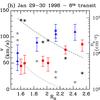
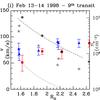
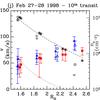
Fig. 3

Outflow speed and electron density vs. distance for the ten limb transits; the dotted and dashed curves are typical density profiles for a CH and a streamer, respectively (see Guhathakurta et al. 1999; Gibson et al. 1999). The solid blue triangles and the solid red squares are the intermediate- and low-latitude outflow speeds, respectively. The five- and ten-point stars represent the electron density values for the intermediate- and low-latitude outflows, respectively. The error bars in the electron density are not shown as they are barely distinguishable in a logarithmic plot; see text for a discussion about the error estimate for v and ne. Analogously to Fig. 2, open triangles and squares refer to the outflow speeds in secondary intermediate- and low-latitude channels; the relative electron densities are given as open ten- and five-point stars.
Current usage metrics show cumulative count of Article Views (full-text article views including HTML views, PDF and ePub downloads, according to the available data) and Abstracts Views on Vision4Press platform.
Data correspond to usage on the plateform after 2015. The current usage metrics is available 48-96 hours after online publication and is updated daily on week days.
Initial download of the metrics may take a while.