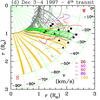
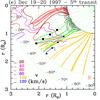
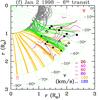
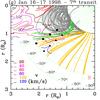
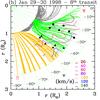
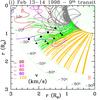
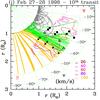
Fig. 2
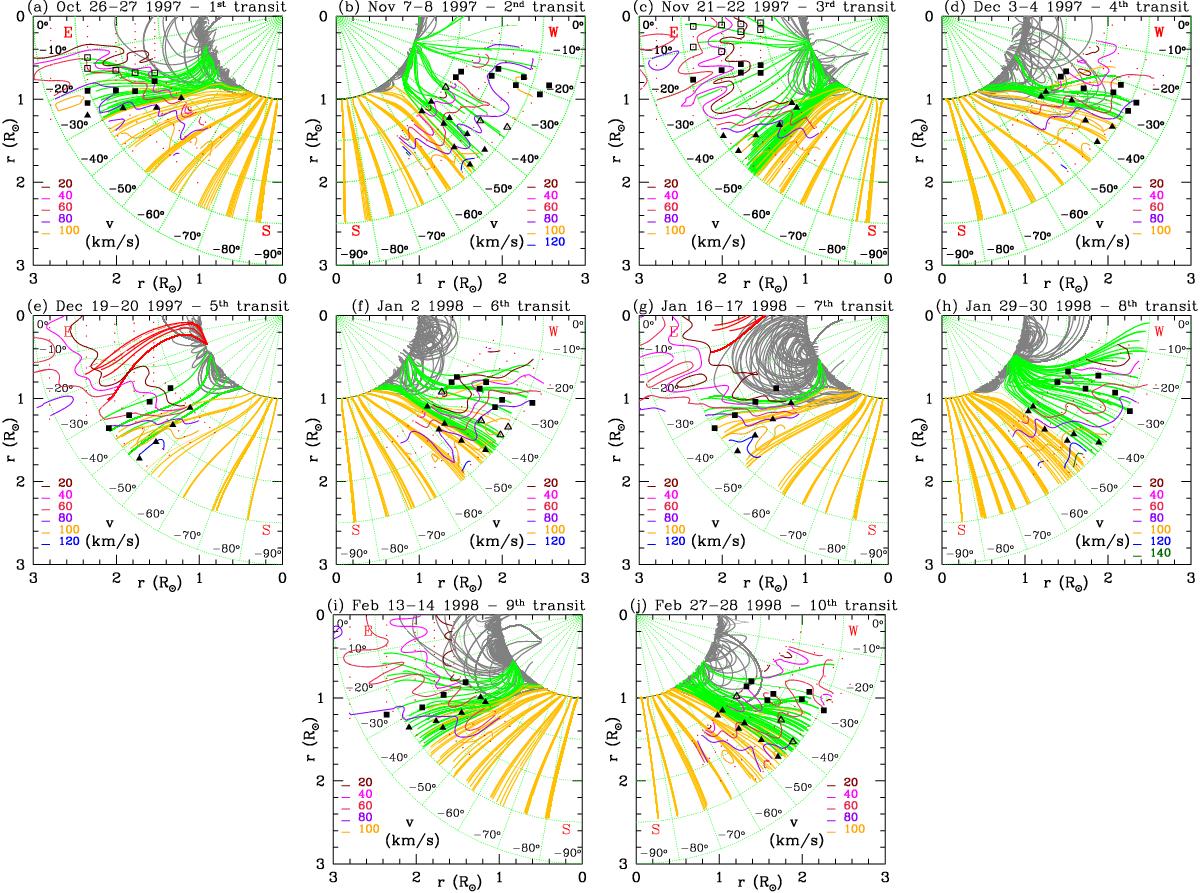
Isocontour maps of the outflow speed for the ten limb transits of AR 8100. Open negative magnetic field lines originating from latitudes lower (higher) than −60 deg are shown in green (orange). In panels e) and g) positive open lines are also shown (red), originating from AR 8100 and from AR 8141 (in the northern emisphere), respectively. The UVCS slits are shown as a sequence of red dots that represent the individual bins. Full triangles (squares) identify data points within the intermediate- (low-)latitude outflow channel candidates. Additional outflow channels whose latitudes are slightly shifted equatorward with respect to the latitudes at which intermediate- and low-latitude channels are found are indicated with open triangles and squares.
Current usage metrics show cumulative count of Article Views (full-text article views including HTML views, PDF and ePub downloads, according to the available data) and Abstracts Views on Vision4Press platform.
Data correspond to usage on the plateform after 2015. The current usage metrics is available 48-96 hours after online publication and is updated daily on week days.
Initial download of the metrics may take a while.