Fig. 2
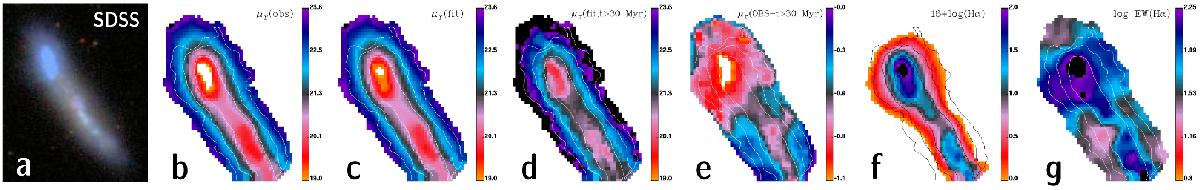
Two-dimensional application of ![]() on CALIFA IFS data for the star-forming galaxy NGC 3991. a) True-color SDSS image composite; b)–d) surface brightness maps (mag/Λ″) computed by spaxel-by-spaxel convolution of the r-band filter transmission curve with the observed spectrum (μobs; panel b), the best-fitting stellar SED to the observed spectrum (μfit; panel c)), and after removal with
on CALIFA IFS data for the star-forming galaxy NGC 3991. a) True-color SDSS image composite; b)–d) surface brightness maps (mag/Λ″) computed by spaxel-by-spaxel convolution of the r-band filter transmission curve with the observed spectrum (μobs; panel b), the best-fitting stellar SED to the observed spectrum (μfit; panel c)), and after removal with ![]() of stellar and nebular emission associated with ongoing or recent (≤30 Myr) star formation (μ(OBS-30 Myr); panel d)). Subtraction of the latter from μobs yields the μ enhancement (in mag) owing to the recent SF (panel e)), which shows a close spatial correlation with the Hα flux (in log 10-16 erg s-1 cm-2; panel f)) and Hα equivalent width (in Å; panel g)).
of stellar and nebular emission associated with ongoing or recent (≤30 Myr) star formation (μ(OBS-30 Myr); panel d)). Subtraction of the latter from μobs yields the μ enhancement (in mag) owing to the recent SF (panel e)), which shows a close spatial correlation with the Hα flux (in log 10-16 erg s-1 cm-2; panel f)) and Hα equivalent width (in Å; panel g)).
Current usage metrics show cumulative count of Article Views (full-text article views including HTML views, PDF and ePub downloads, according to the available data) and Abstracts Views on Vision4Press platform.
Data correspond to usage on the plateform after 2015. The current usage metrics is available 48-96 hours after online publication and is updated daily on week days.
Initial download of the metrics may take a while.