Fig. 1
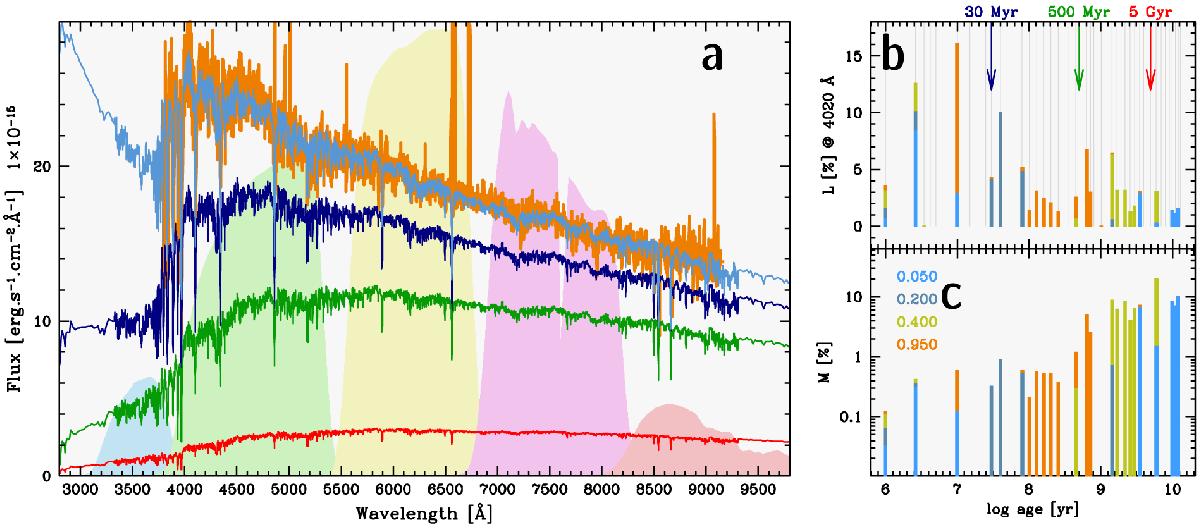
a) Example of the application of ![]() to the best-fitting synthetic SED (light blue) obtained with Starlight for a SDSS-DR7 (York et al. 2000) spectrum (orange) for three tcut values: 30 Myr (blue), 0.5 Gyr (green), and 5 Gyr (red). The transmission curves of the five SDSS filters u, g, r, i, and z are depicted with shaded areas. Panels b) and c) show, respectively, the luminosity (xj) and mass (μj) contribution (%) of individual SSPs (1 ...j) to the best-fitting population vector. The light-gray vertical lines in the upper-right panel show the ages available in the SSP library for four metallicities (between 0.05 and 0.95 Z⊙) and vertical arrows depict the applied tcut values. From panels b) and c) it is apparent that, according to the best-fitting population vector, SSPs younger than 30 Myr contribute less than 2% of ℳ⋆ but nearly 35% of the observed intensity at the normalization wavelength of 4020 Å. As a result, suppression of these young SSPs results in a significant dimming by 0.56, 0.27, 0.22, and 0.19 mag in the SDSS u, g, r, and i-bands, respectively.
to the best-fitting synthetic SED (light blue) obtained with Starlight for a SDSS-DR7 (York et al. 2000) spectrum (orange) for three tcut values: 30 Myr (blue), 0.5 Gyr (green), and 5 Gyr (red). The transmission curves of the five SDSS filters u, g, r, i, and z are depicted with shaded areas. Panels b) and c) show, respectively, the luminosity (xj) and mass (μj) contribution (%) of individual SSPs (1 ...j) to the best-fitting population vector. The light-gray vertical lines in the upper-right panel show the ages available in the SSP library for four metallicities (between 0.05 and 0.95 Z⊙) and vertical arrows depict the applied tcut values. From panels b) and c) it is apparent that, according to the best-fitting population vector, SSPs younger than 30 Myr contribute less than 2% of ℳ⋆ but nearly 35% of the observed intensity at the normalization wavelength of 4020 Å. As a result, suppression of these young SSPs results in a significant dimming by 0.56, 0.27, 0.22, and 0.19 mag in the SDSS u, g, r, and i-bands, respectively.
Current usage metrics show cumulative count of Article Views (full-text article views including HTML views, PDF and ePub downloads, according to the available data) and Abstracts Views on Vision4Press platform.
Data correspond to usage on the plateform after 2015. The current usage metrics is available 48-96 hours after online publication and is updated daily on week days.
Initial download of the metrics may take a while.