Fig. 9
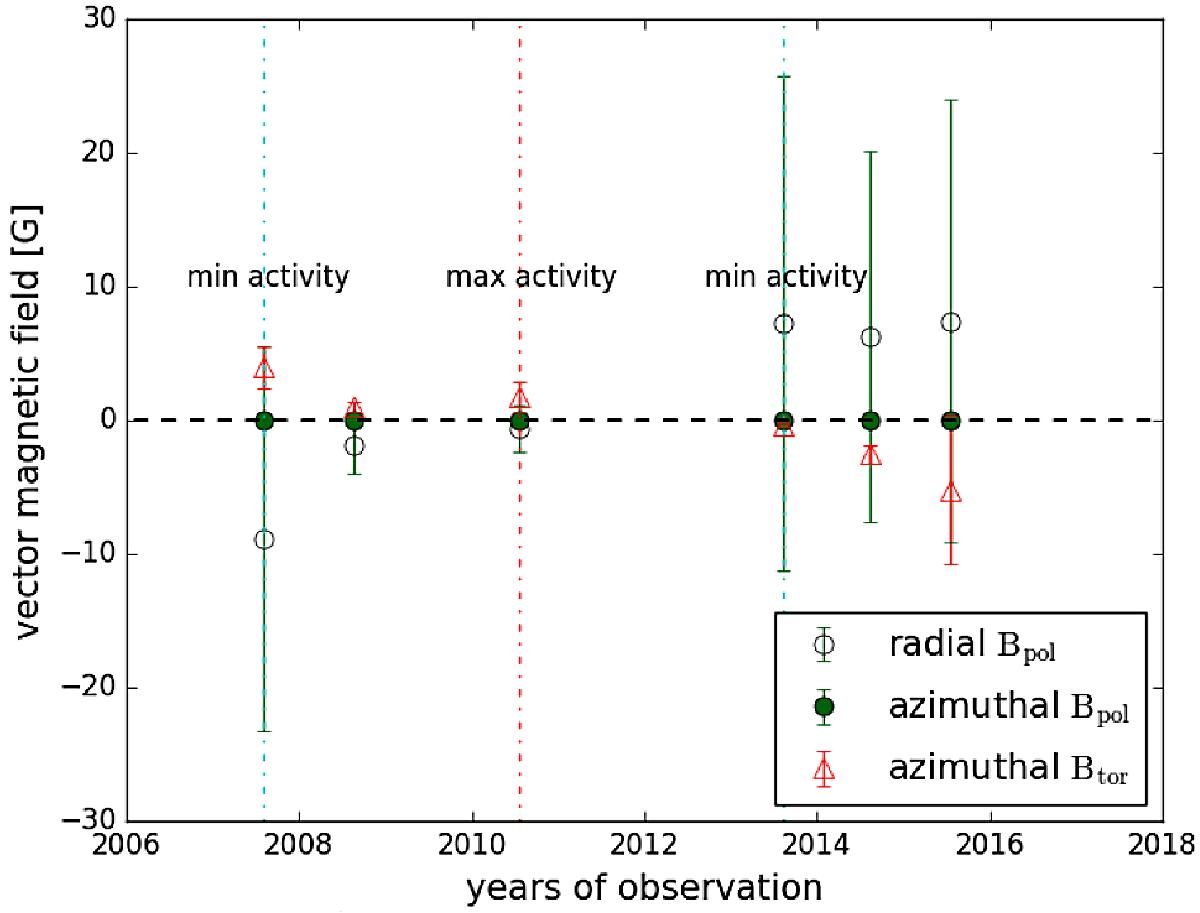
Vector component of the poloidal and toroidal magnetic field strength averaged over the stellar surface. The field strengths in the radial and azimuthal components are shown. The horizontal dashed line shows where the field strength is 0. The cyan vertical dashed lines show the epochs with minimum activity and the red vertical dashed line shows the epoch with maximum chromospheric activity.
Current usage metrics show cumulative count of Article Views (full-text article views including HTML views, PDF and ePub downloads, according to the available data) and Abstracts Views on Vision4Press platform.
Data correspond to usage on the plateform after 2015. The current usage metrics is available 48-96 hours after online publication and is updated daily on week days.
Initial download of the metrics may take a while.