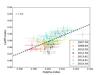
Fig. 4
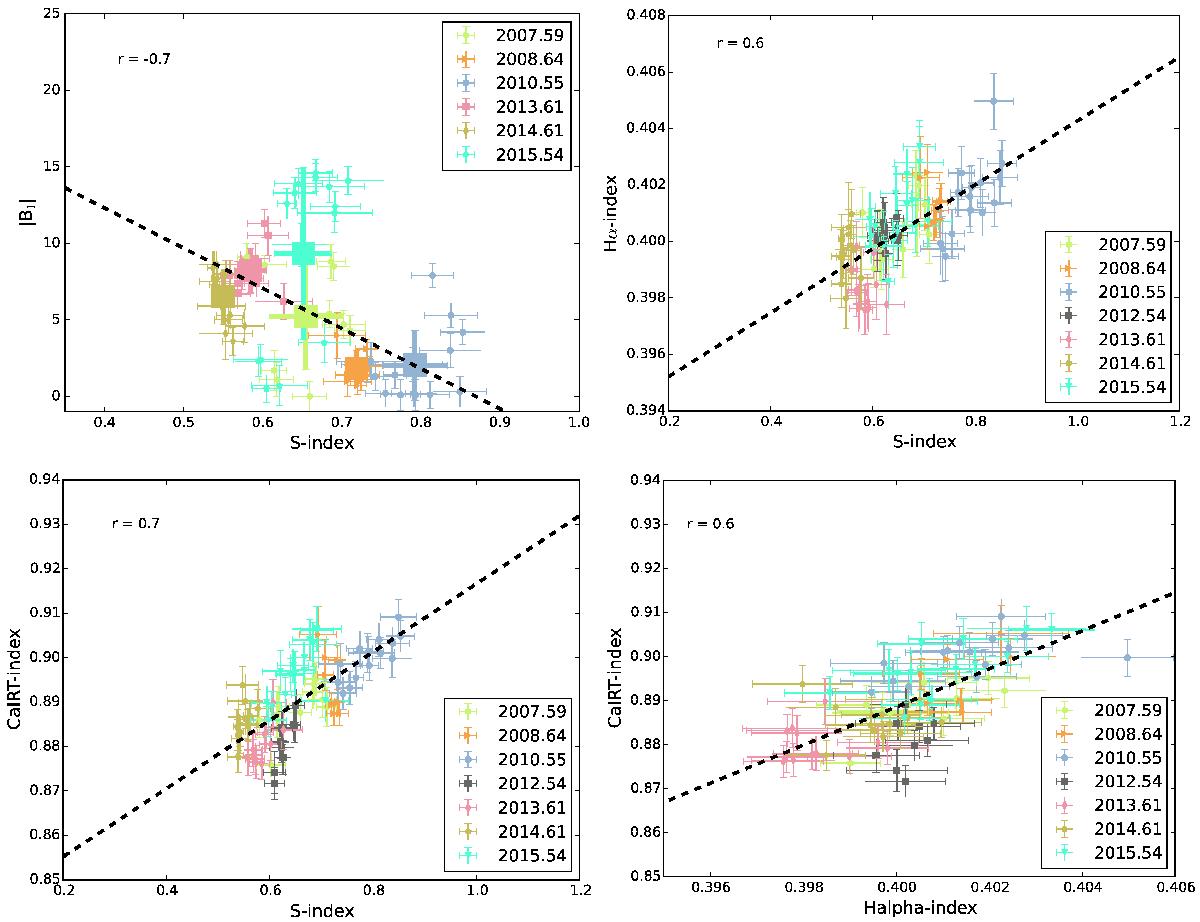
Correlation between the different activity indicators and the longitudinal field | Bl |, where the dashed line represents least square fit to the data and the Pearson’s r is shown in the plot. Top left: anti-correlation between S-index and | Bl | over six epochs of observations. The bold crosses represent the mean and standard deviation as dispersion. Only the mean values are included in the fit. Top right: plot showing the correlation between S-index and Hα-index over seven epochs of observations. Bottom left: correlation between S-index and CaIRT-index over seven epochs of data. Bottom right: correlation between Hα-index and CaIRT-index over seven epochs of data.
Current usage metrics show cumulative count of Article Views (full-text article views including HTML views, PDF and ePub downloads, according to the available data) and Abstracts Views on Vision4Press platform.
Data correspond to usage on the plateform after 2015. The current usage metrics is available 48-96 hours after online publication and is updated daily on week days.
Initial download of the metrics may take a while.