Free Access
Fig. B.1
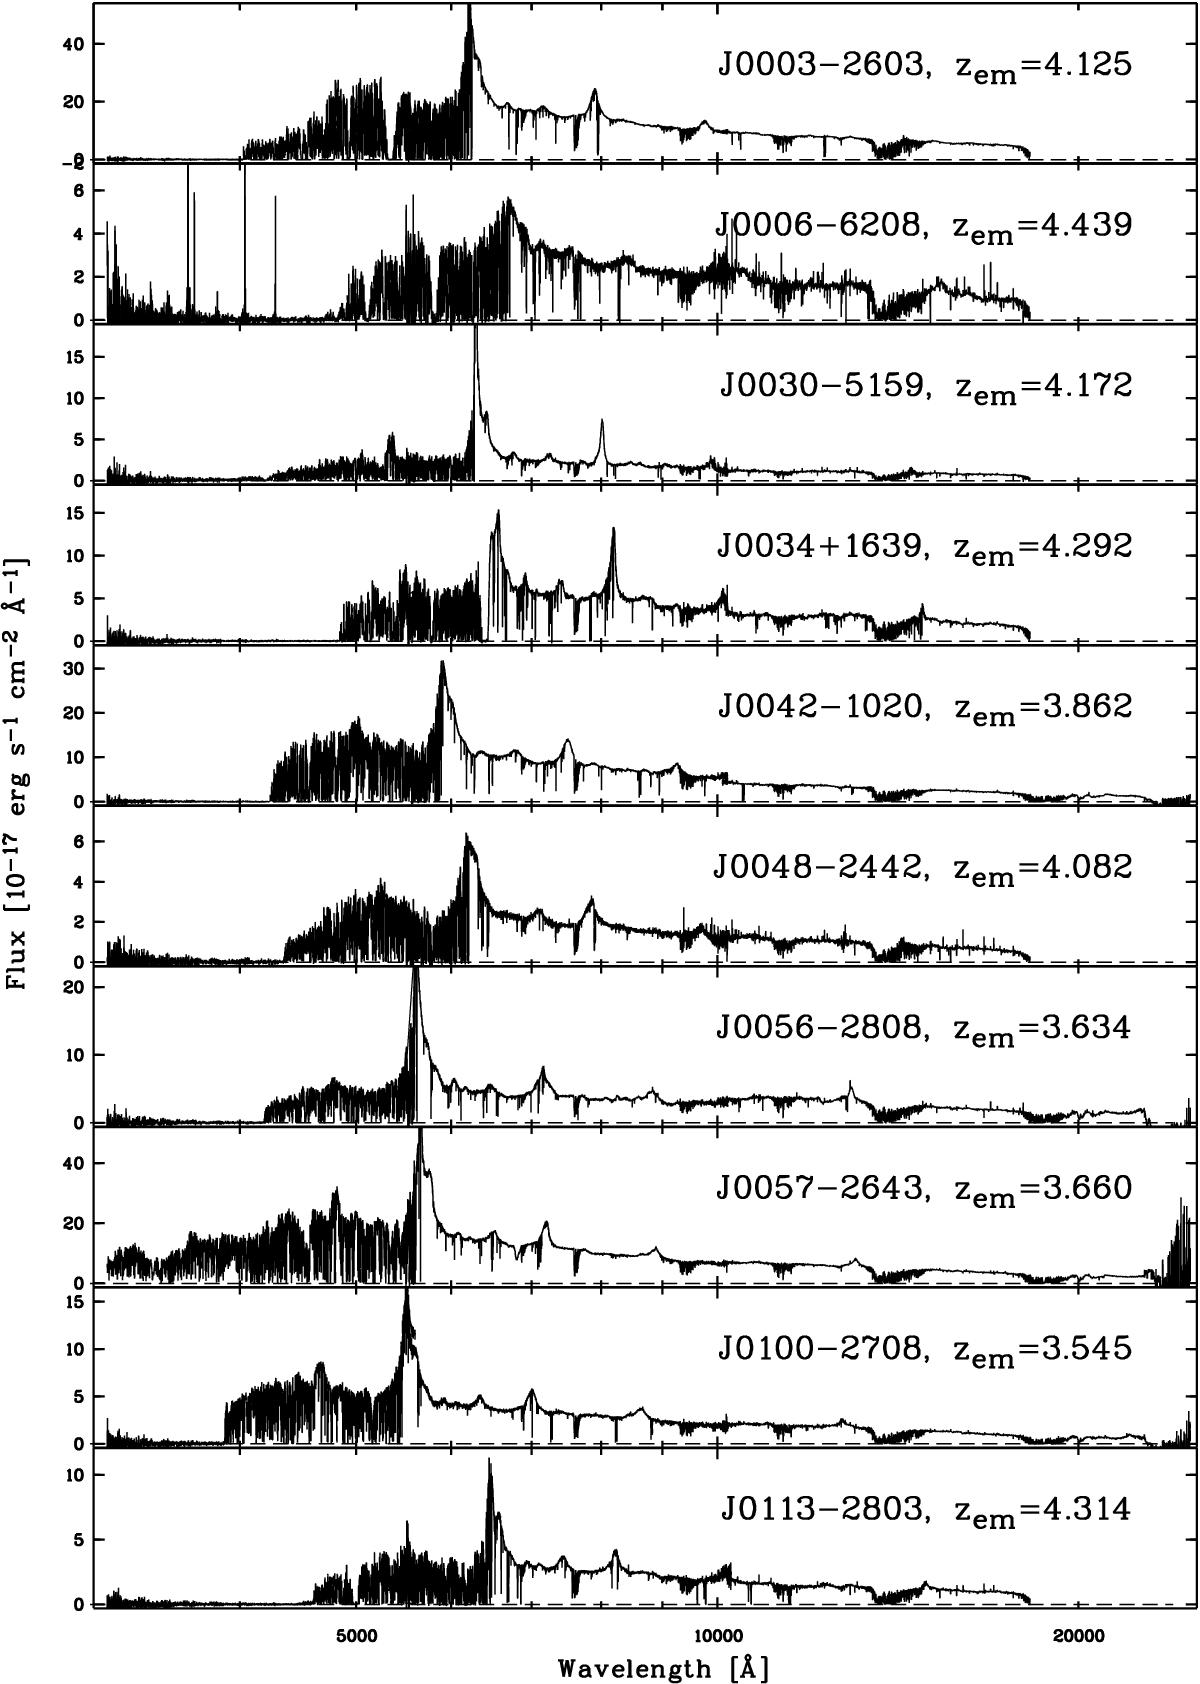
XQ-100 spectra. Names follow the XQ-100 convention (Sect. 5); see Table A.1 for a correspondence with literature names. Emission redshifts were estimated using the result of a principal component analysis (Pâris et al. 2012). The flux has been smoothed with a five-pixel median filter for displaying purposes.
Current usage metrics show cumulative count of Article Views (full-text article views including HTML views, PDF and ePub downloads, according to the available data) and Abstracts Views on Vision4Press platform.
Data correspond to usage on the plateform after 2015. The current usage metrics is available 48-96 hours after online publication and is updated daily on week days.
Initial download of the metrics may take a while.