Fig. 8
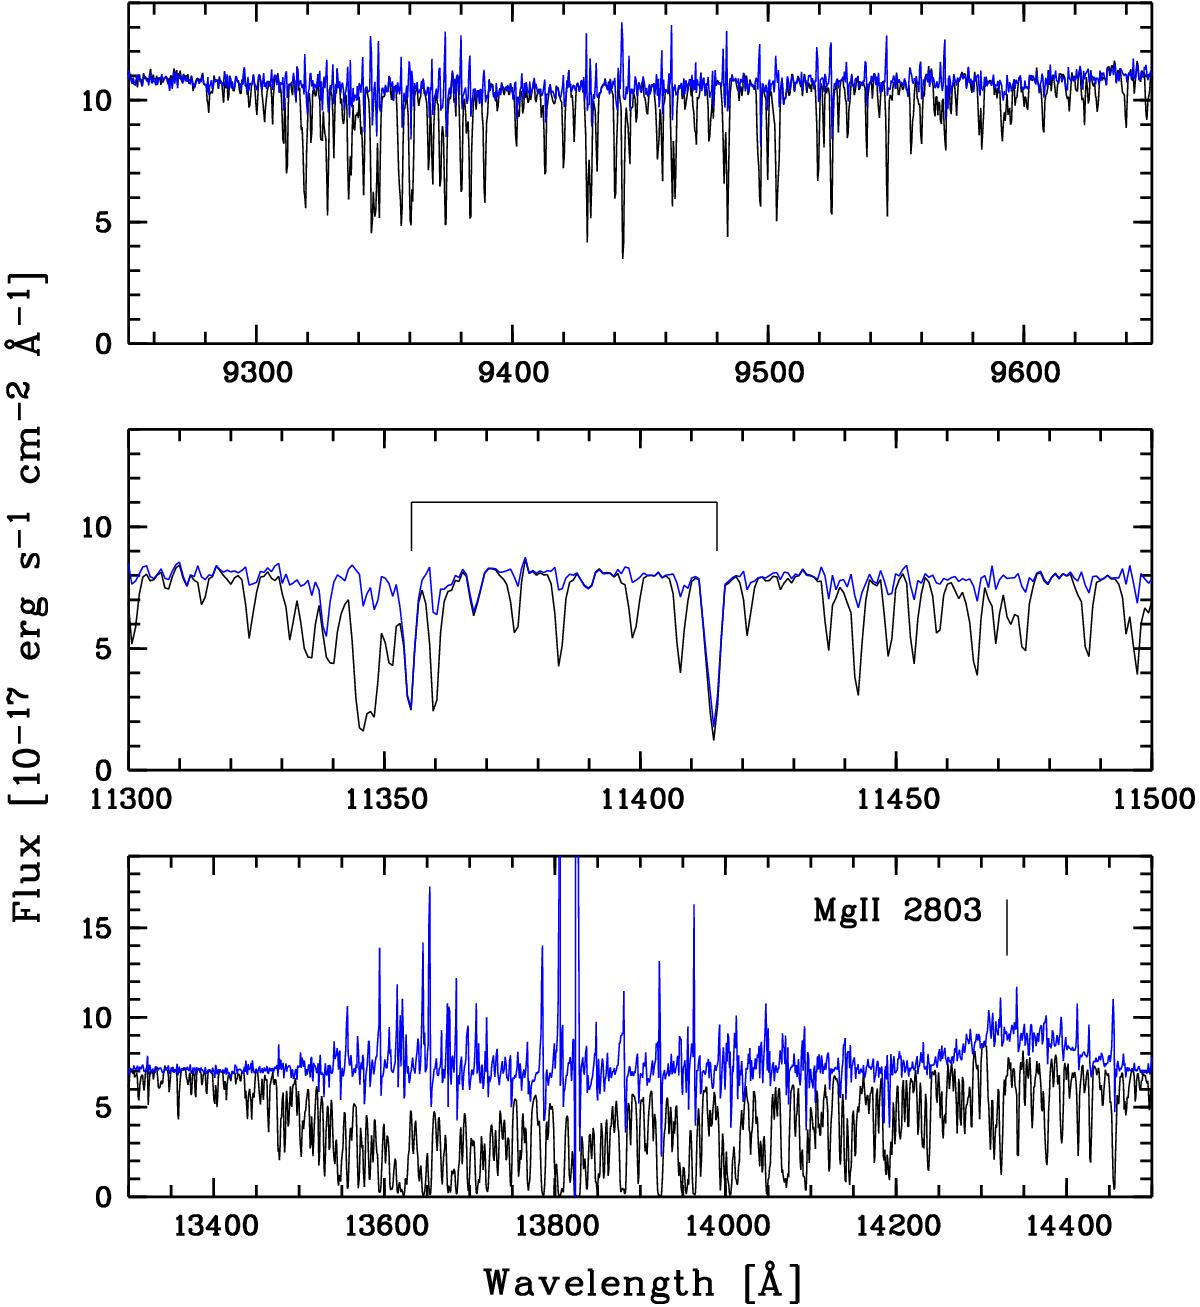
Spectrum of QSO J0003−2603 at z = 4.125 before (black) and after (blue) telluric corrections. Three spectral windows with strong telluric absorption are shown. In the middle panel the tickmarks above the spectrum indicate two Fe ii absorption lines, λ2586 and λ2600 Å, associated with the z = 3.390 DLA. In the bottom panel we note how the Mg ii emission line stands out in the corrected spectrum.
Current usage metrics show cumulative count of Article Views (full-text article views including HTML views, PDF and ePub downloads, according to the available data) and Abstracts Views on Vision4Press platform.
Data correspond to usage on the plateform after 2015. The current usage metrics is available 48-96 hours after online publication and is updated daily on week days.
Initial download of the metrics may take a while.