Fig. 7
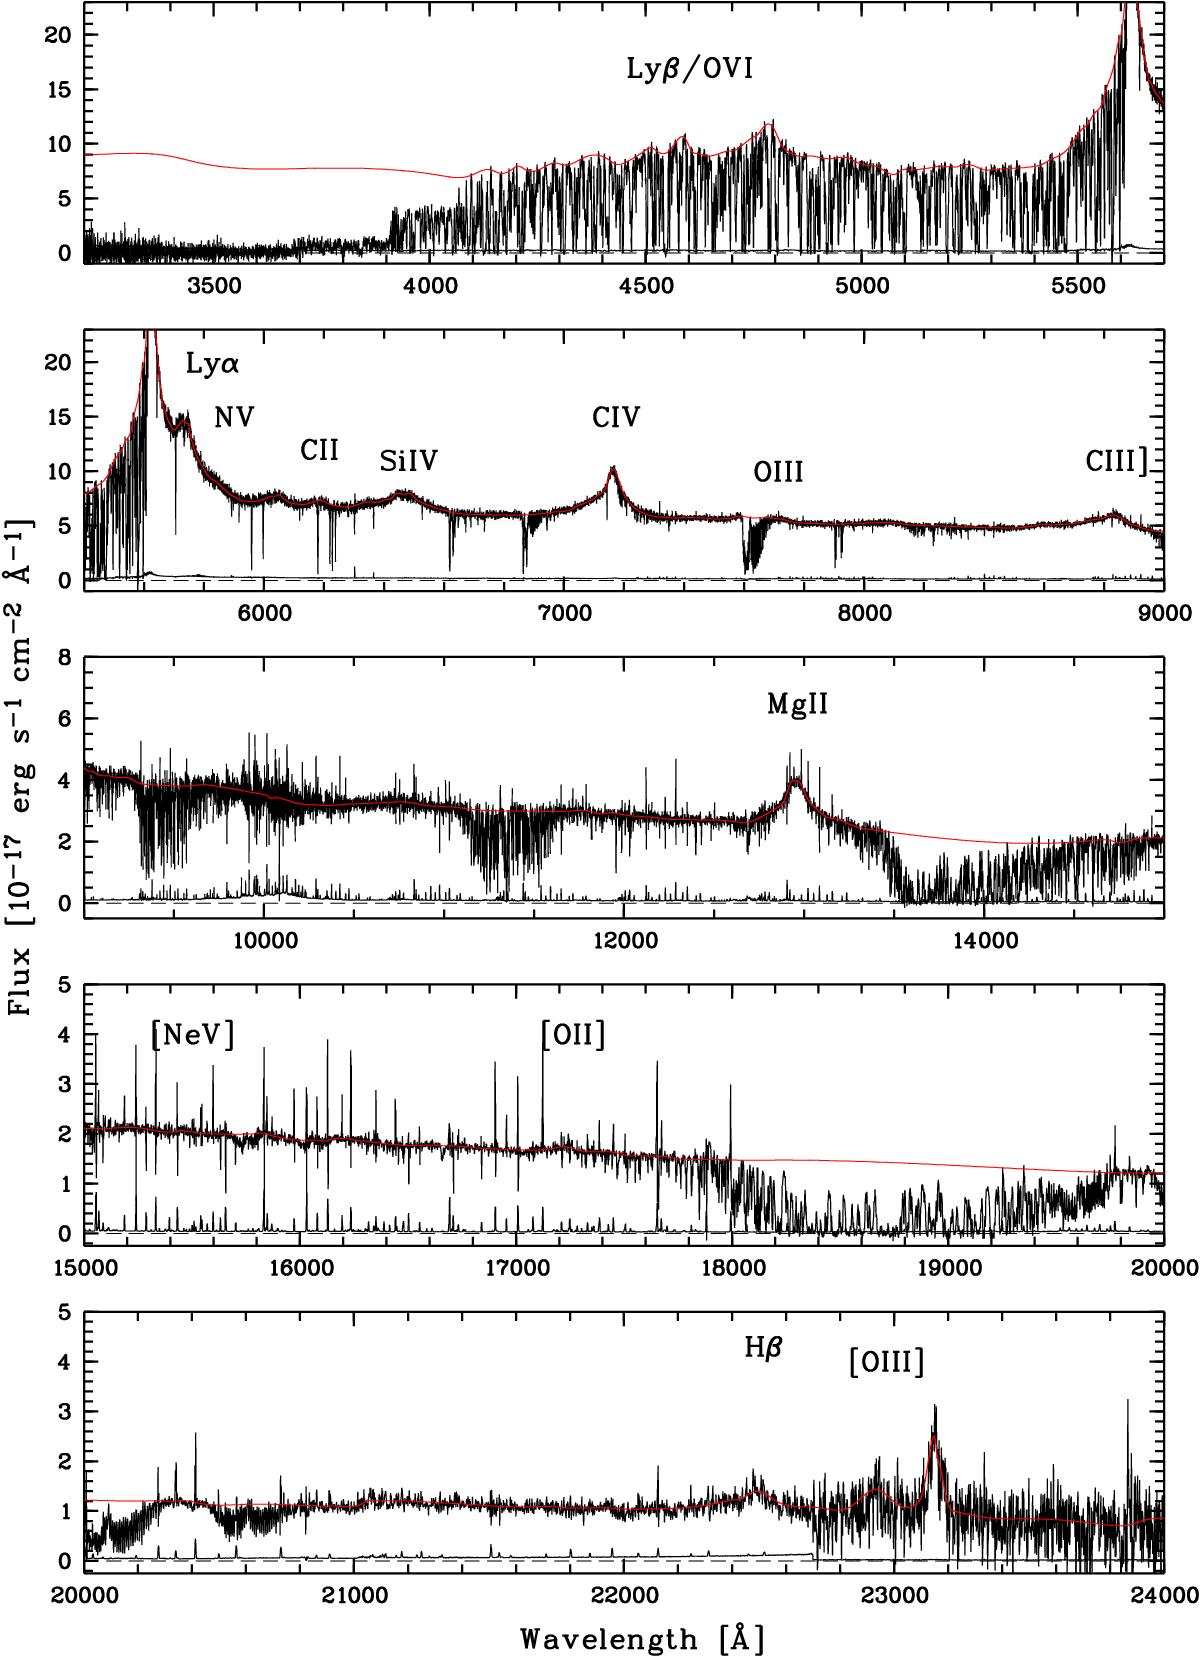
XQ-100 spectrum of QSO J1117+1311 at z = 3.622, a representative case of the whole sample in terms of S/N. The flux is not corrected for telluric absorption (Sect. 4.1) or rebinned for display purposes. Some emission lines are marked. The red line depicts a manually placed continuum made of cubic splines (see Sect. 4.2 for details). The complete set of XQ-100 spectra is shown in Fig. B.1.
Current usage metrics show cumulative count of Article Views (full-text article views including HTML views, PDF and ePub downloads, according to the available data) and Abstracts Views on Vision4Press platform.
Data correspond to usage on the plateform after 2015. The current usage metrics is available 48-96 hours after online publication and is updated daily on week days.
Initial download of the metrics may take a while.