Free Access
Fig. 5
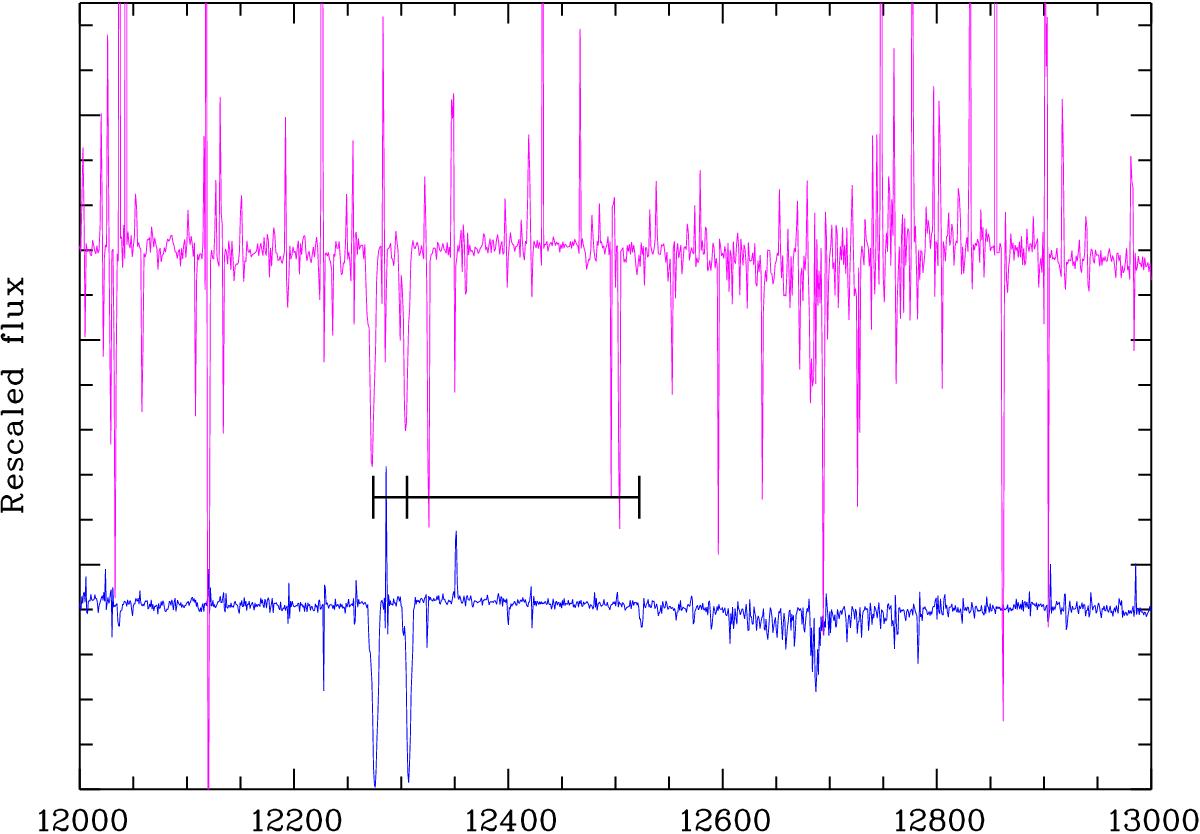
Portion of the NIR spectrum of QSO J0003-2603 at z = 4.125 reduced using the X-shooter/Reflex pipeline, version 2.5.2 (top) and our own idl pipeline (bottom). The tickmarks in between spectra indicate Mg ii and Mg i absorption lines in a DLA at z = 3.390. The bottom spectrum is much less affected by the residuals.
Current usage metrics show cumulative count of Article Views (full-text article views including HTML views, PDF and ePub downloads, according to the available data) and Abstracts Views on Vision4Press platform.
Data correspond to usage on the plateform after 2015. The current usage metrics is available 48-96 hours after online publication and is updated daily on week days.
Initial download of the metrics may take a while.