Fig. 4
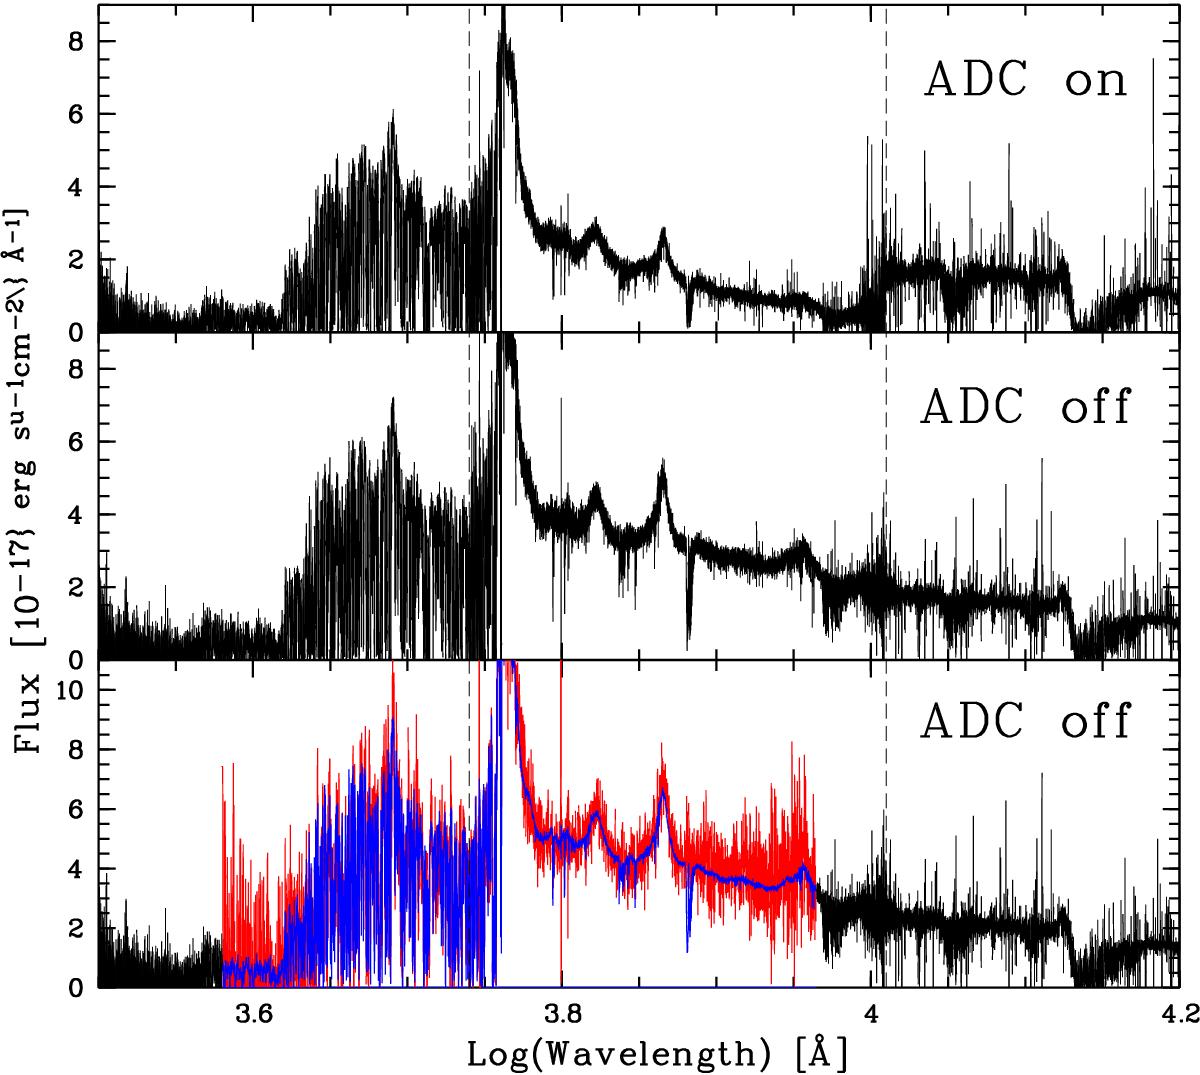
XQ-100 spectra of the same QSO, J1126−0124, taken with the faulty ADCs in April 2012 (top panel) and repeated with the disabled ADCs in February 2014 (middle panel). Both observations were executed at a similar airmass of ≈ 1.3 at the parallactic angle. The dashed lines indicate the boundaries of the X-shooter arms. The match is better between the VIS and NIR arms in the middle panel. The bottom panel shows the same February 2014 XQ-100 spectrum but smoothed and rebinned to SDSS resolution (blue line), and rescaled by a factor of 1.3 to match the corresponding SDSS spectrum (overlaid in red). The good match suggests that slit losses in the XQ-100 data are roughly achromatic.
Current usage metrics show cumulative count of Article Views (full-text article views including HTML views, PDF and ePub downloads, according to the available data) and Abstracts Views on Vision4Press platform.
Data correspond to usage on the plateform after 2015. The current usage metrics is available 48-96 hours after online publication and is updated daily on week days.
Initial download of the metrics may take a while.