Fig. 4
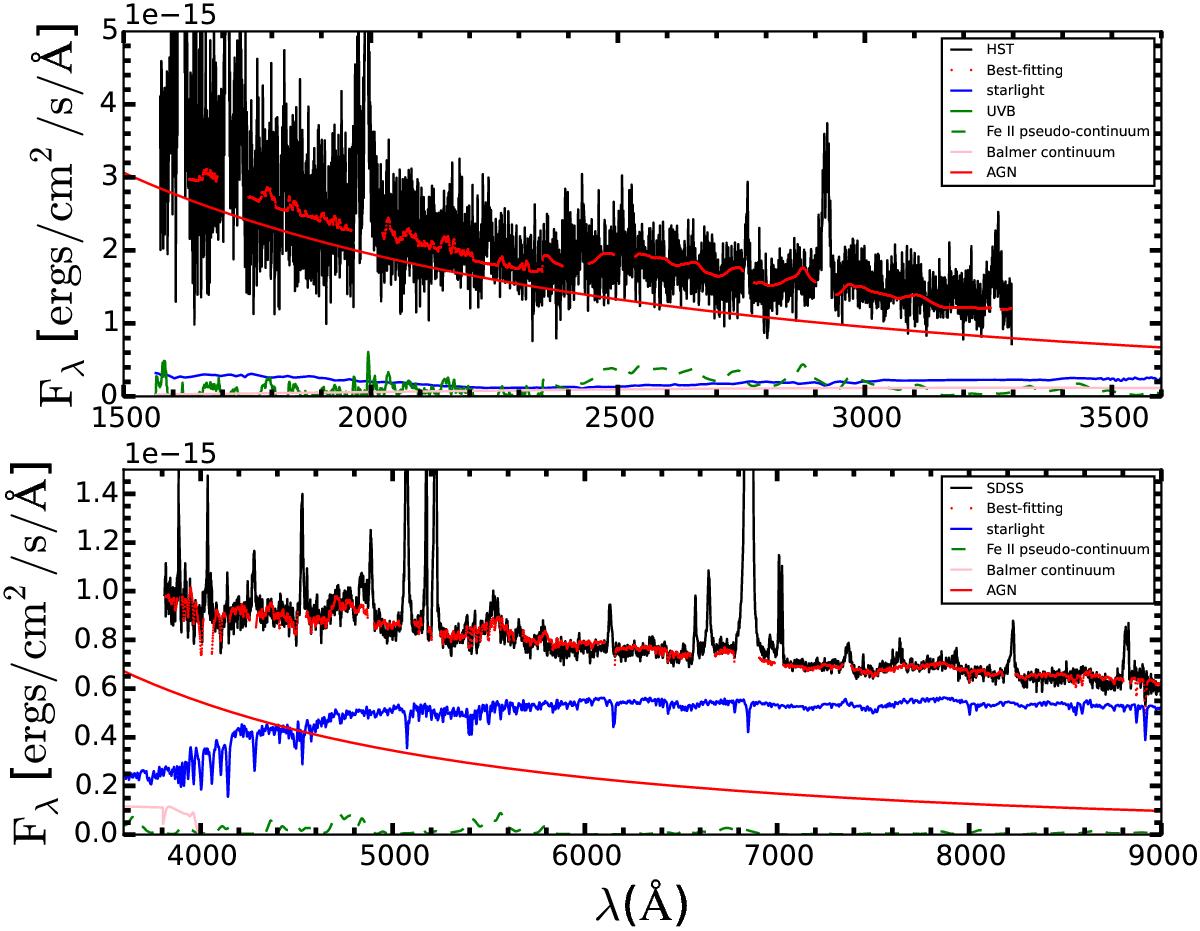
Fit of the a = 0 (log M = 6.55) model (see Table 2) to the optical/UV spectrum of RE J1034+396 (red line) to the data (black line); red line below shows the disk contribution, pink line − Balmer Continuum, green solid line the Fe II contribution below 2250 Å (Vestergaard & Wilkes 2001), green dashed line the Fe II above 2250 Å (Bruhweiler & Verner 2008). Stars contribute significantly to the spectrum even in UV part. The HST data are renormalized by constant 0.717.
Current usage metrics show cumulative count of Article Views (full-text article views including HTML views, PDF and ePub downloads, according to the available data) and Abstracts Views on Vision4Press platform.
Data correspond to usage on the plateform after 2015. The current usage metrics is available 48-96 hours after online publication and is updated daily on week days.
Initial download of the metrics may take a while.