Fig. 3
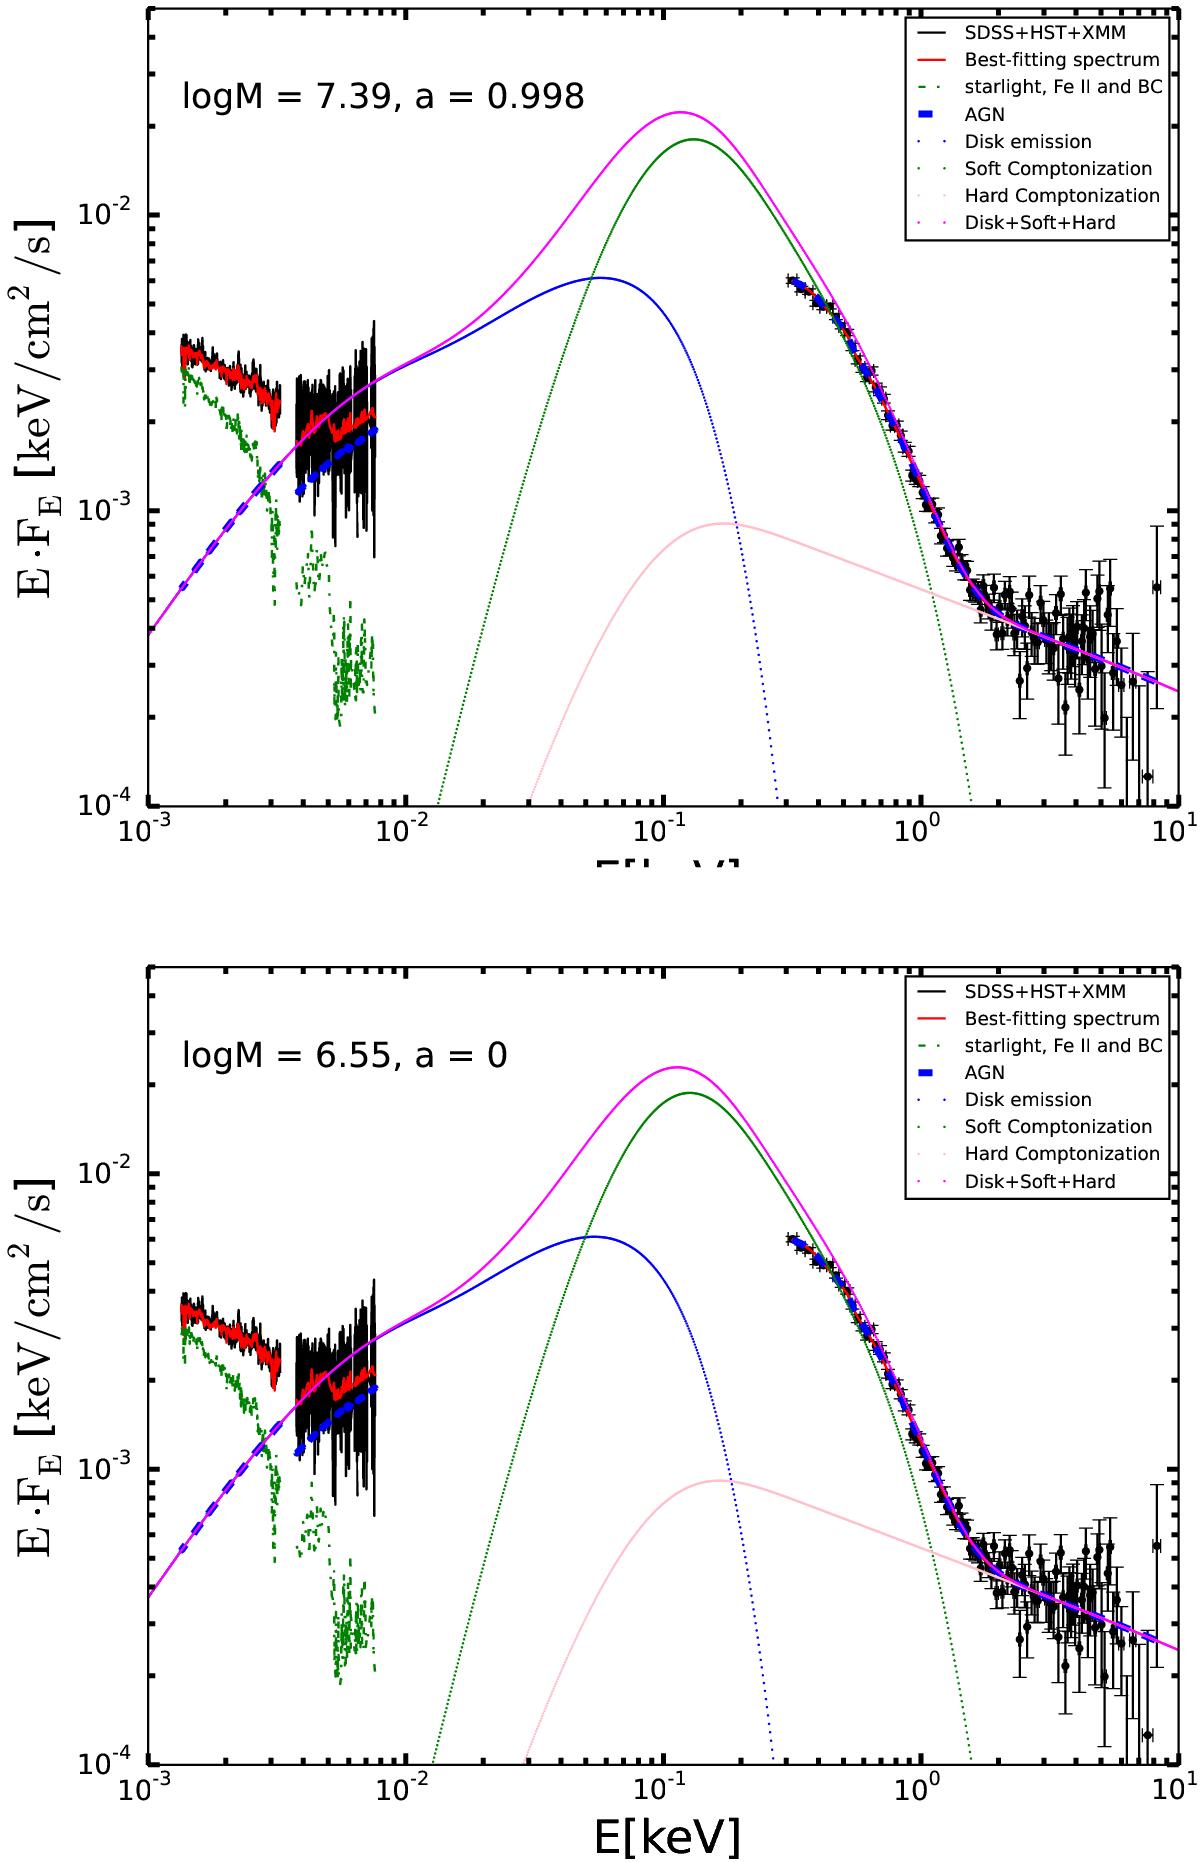
Broadband fitting of the disk to the optical/UV/X-ray data for a = 0.998 (upper panel, best fit log MBH/M⊙ = 7.39) and a = 0 (lower panel, best fit log MBH/M⊙ = 6.55). The red solid line represents the models OPTXAGNF with the best-fitting values given in Table 2, and the Galactic extinction TBABS and the HST data shift applied to the data is not included here, which explains the departure of the data/model in soft X-rays and HST disk plot. The blue, green, and pink dashed lines represent the disk blackbody, soft Compton, and hard Compton components, respectively.

Current usage metrics show cumulative count of Article Views (full-text article views including HTML views, PDF and ePub downloads, according to the available data) and Abstracts Views on Vision4Press platform.
Data correspond to usage on the plateform after 2015. The current usage metrics is available 48-96 hours after online publication and is updated daily on week days.
Initial download of the metrics may take a while.