Fig. 4
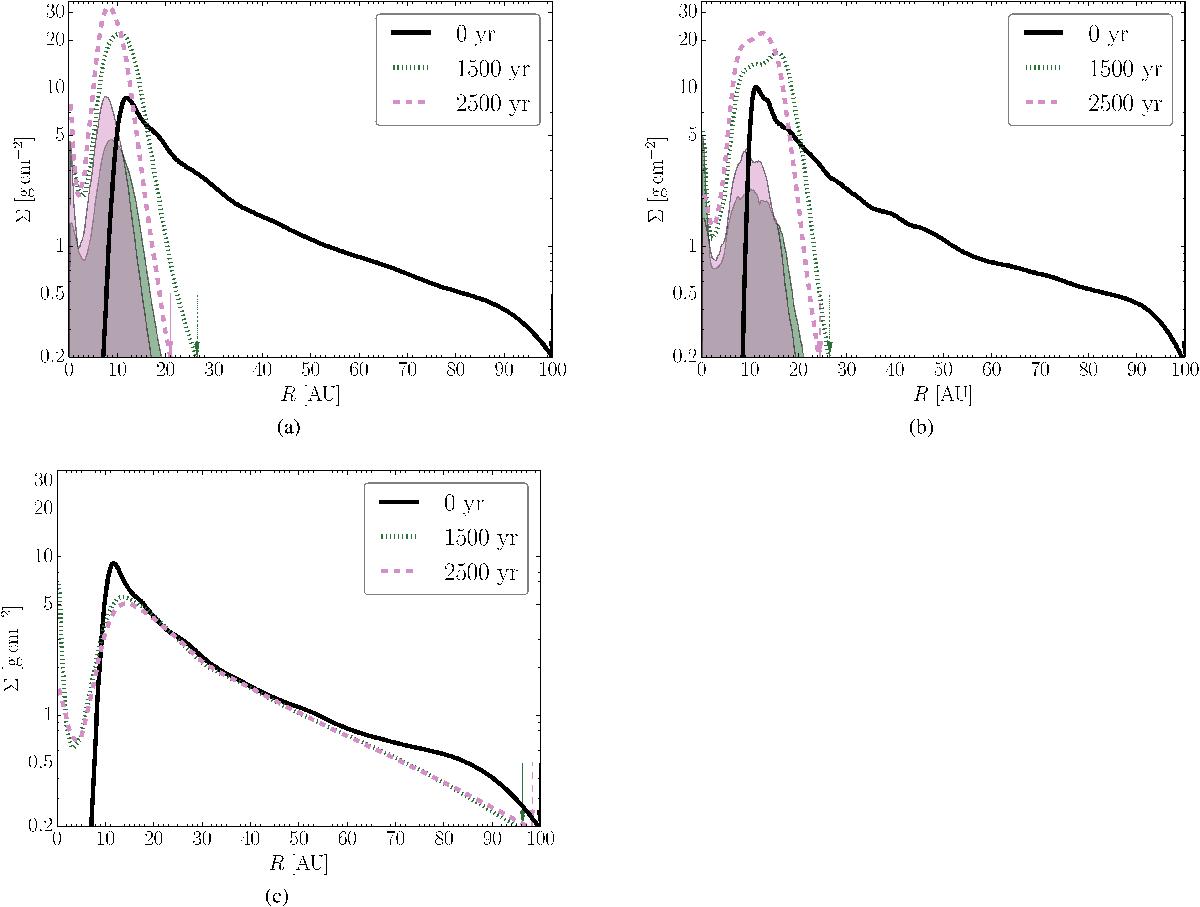
a) Azimuthally averaged surface density profile for the G16 simulation, Σ(r), at the start (solid black line), after 1500 yr (dashed purple line) and after 2500 yr (dotted green line). The contribution of swept-up ISM at each moment is plotted in the corresponding transparent colour. The vertical arrows in the same colour as the surface density profile indicate the radius of the disc at that moment. b) Same as the left figure, but for the F16 simulation. The initial inner radius at 10 AU is better resolved by Fi than by Gadget2. c) Same as a), but for the reference model without inflow of ISM.
Current usage metrics show cumulative count of Article Views (full-text article views including HTML views, PDF and ePub downloads, according to the available data) and Abstracts Views on Vision4Press platform.
Data correspond to usage on the plateform after 2015. The current usage metrics is available 48-96 hours after online publication and is updated daily on week days.
Initial download of the metrics may take a while.