Fig. 3
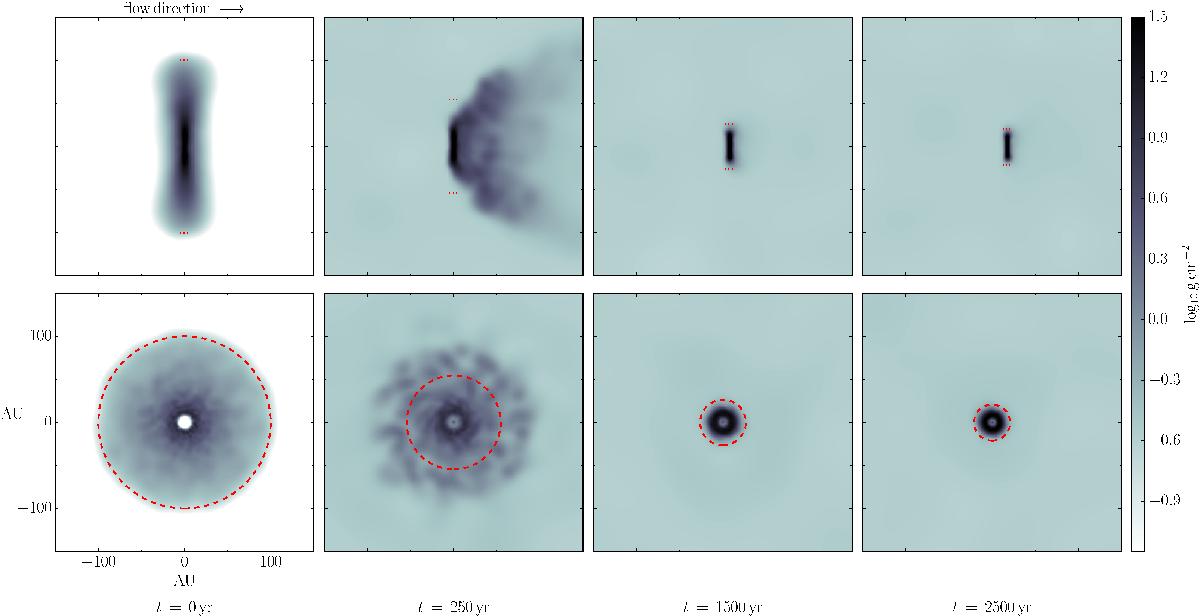
Edge-on (top row) and face-on (bottom row) snapshots from the simulations with our reference model. The column density is shown in logarithmic scale and integrated along the full computational domain. The spatial scale is indicated in the bottom left and the flow direction on the top left. The red circle (bottom row) and dotted bars (top row) indicate the size of the disc as determined from its radius (see Sect. 3.3).
Current usage metrics show cumulative count of Article Views (full-text article views including HTML views, PDF and ePub downloads, according to the available data) and Abstracts Views on Vision4Press platform.
Data correspond to usage on the plateform after 2015. The current usage metrics is available 48-96 hours after online publication and is updated daily on week days.
Initial download of the metrics may take a while.