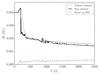
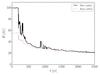
Fig. 2
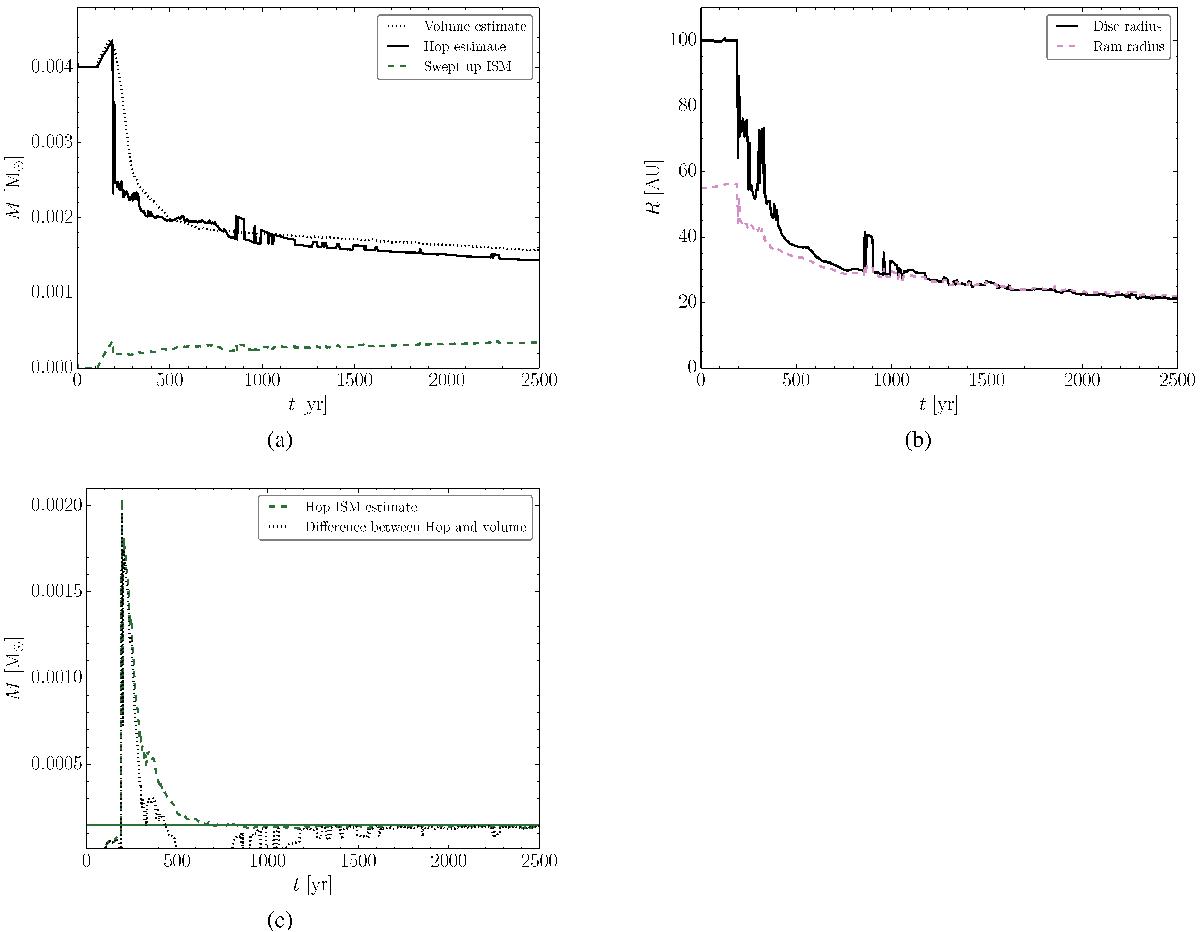
a) Mass of the disc determined in 2 different ways: (1) by drawing a cylinder around the disc and adding the mass of all the particles in that volume (dotted black line) and (2) from the Hop algorithm we use (solid black line, see Sect. 3.3). The green dashed line shows the cumulative swept-up ISM mass, i.e. the sum of ISM in the disc and ISM that has been accreted onto the star, as derived with the Hop algorithm. b) Radius of the disc (solid black line) and the radius beyond which the ram pressure dominates, both derived from the surface density profile (see Sect. 3.3). c) Solid green horizontal line gives the mass of the volume around the disc, assuming it is completely filled with ISM. The dashed green line gives the mass of ISM that is in the volume but not in the disc, as derived with the Hop algorithm. The dotted black line gives the mass of ISM in the volume by calculating the difference between the total mass in the volume and the hop estimate for the disc, i.e. the difference between the solid black line and the dotted black line from the top figure. After ~1500 yr, the methods agree very well.
Current usage metrics show cumulative count of Article Views (full-text article views including HTML views, PDF and ePub downloads, according to the available data) and Abstracts Views on Vision4Press platform.
Data correspond to usage on the plateform after 2015. The current usage metrics is available 48-96 hours after online publication and is updated daily on week days.
Initial download of the metrics may take a while.