Fig. 6
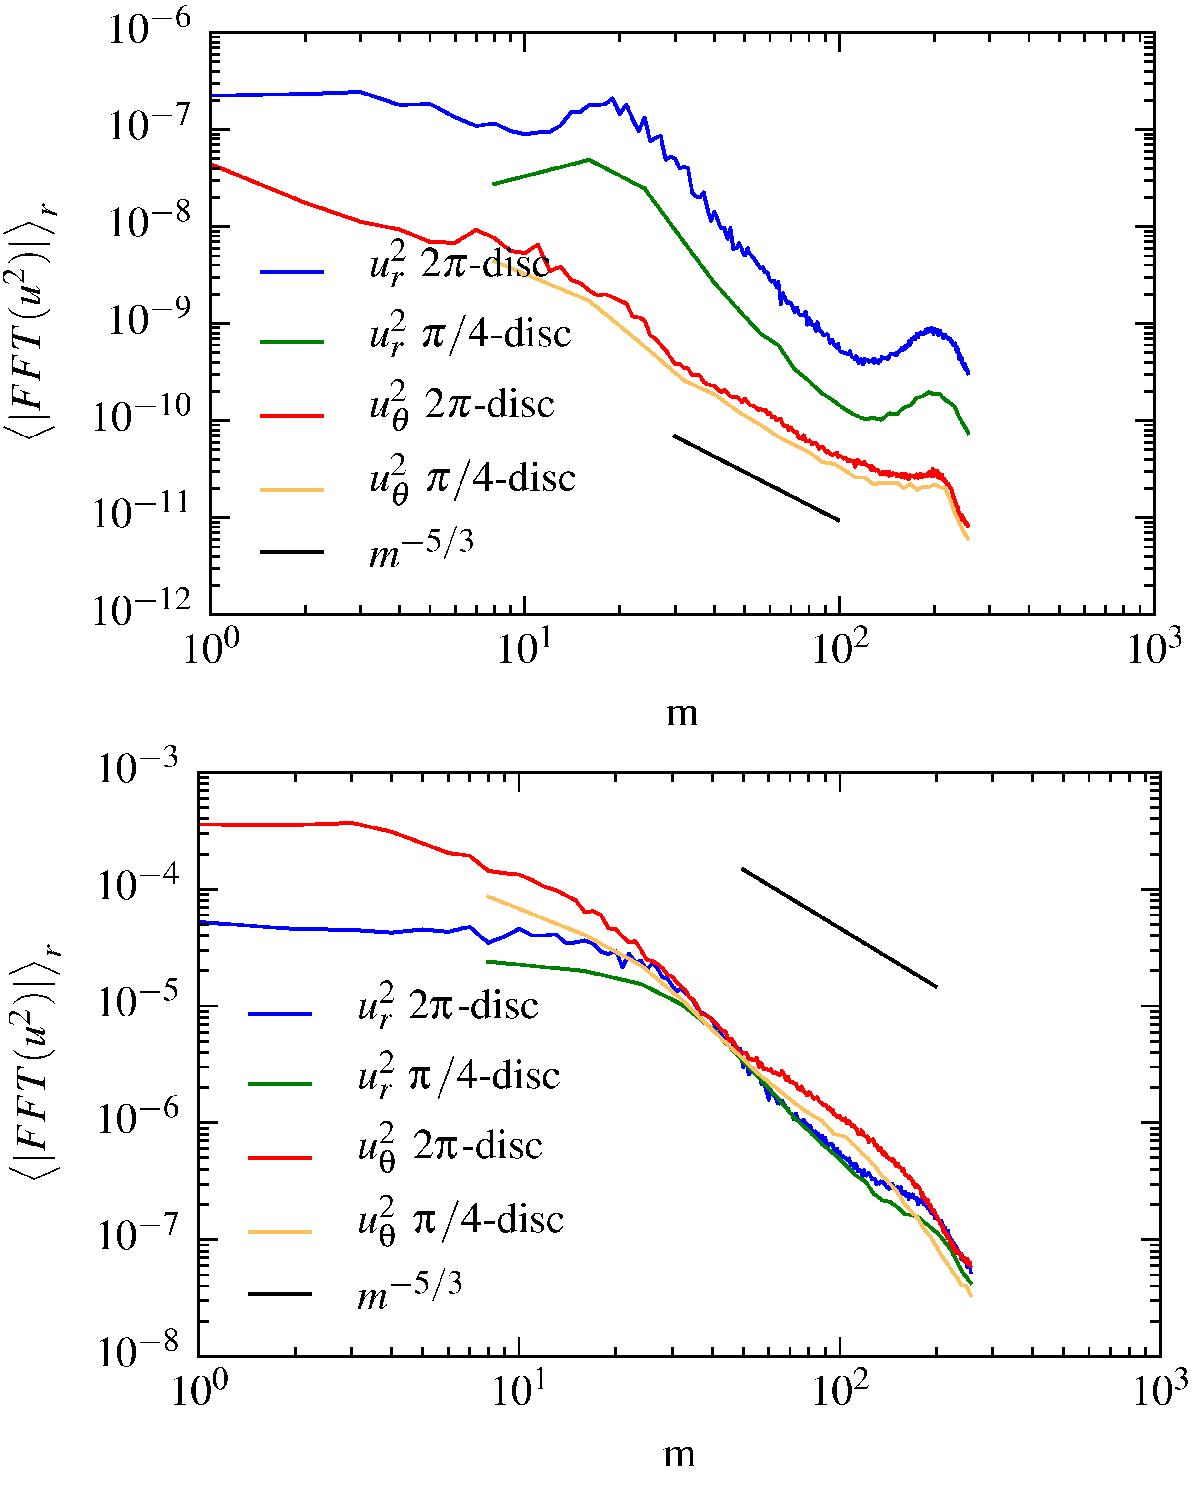
Power spectrum for the different kinetic energy components along the azimuthal direction in the disc midplane averaged over the radial direction. The black line shows the Kolmogorov spectrum decaying with | u(m) | 2 ∝ m− 5 / 3, where m denotes the azimuthal wave number. The top panel refers to the growth phase after 200 yr and the lower panel to the quasi-stationary phase after 1700 yr.
Current usage metrics show cumulative count of Article Views (full-text article views including HTML views, PDF and ePub downloads, according to the available data) and Abstracts Views on Vision4Press platform.
Data correspond to usage on the plateform after 2015. The current usage metrics is available 48-96 hours after online publication and is updated daily on week days.
Initial download of the metrics may take a while.