Fig. 24
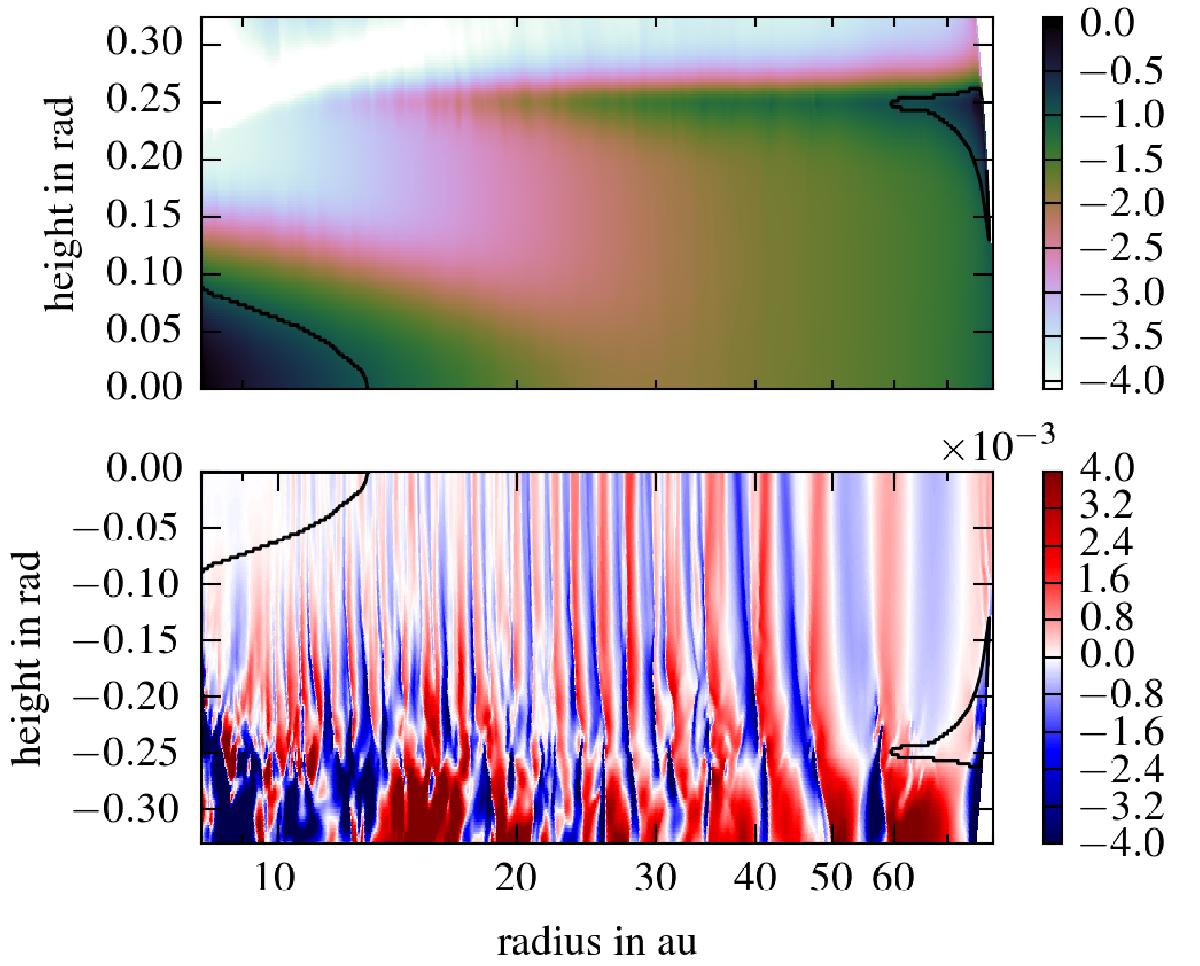
Dimensionless cooling time (upper panel) and vertical velocity (lower panel) for the irradiated disc after 13 500 yr. The top panel shows the upper half of the disc while the lower panel the lower one at the same time slice. The black line indicates the location of the critical cooling time τcrit (see text), which separates the active from the inactive region.
Current usage metrics show cumulative count of Article Views (full-text article views including HTML views, PDF and ePub downloads, according to the available data) and Abstracts Views on Vision4Press platform.
Data correspond to usage on the plateform after 2015. The current usage metrics is available 48-96 hours after online publication and is updated daily on week days.
Initial download of the metrics may take a while.