Free Access
Fig. 12
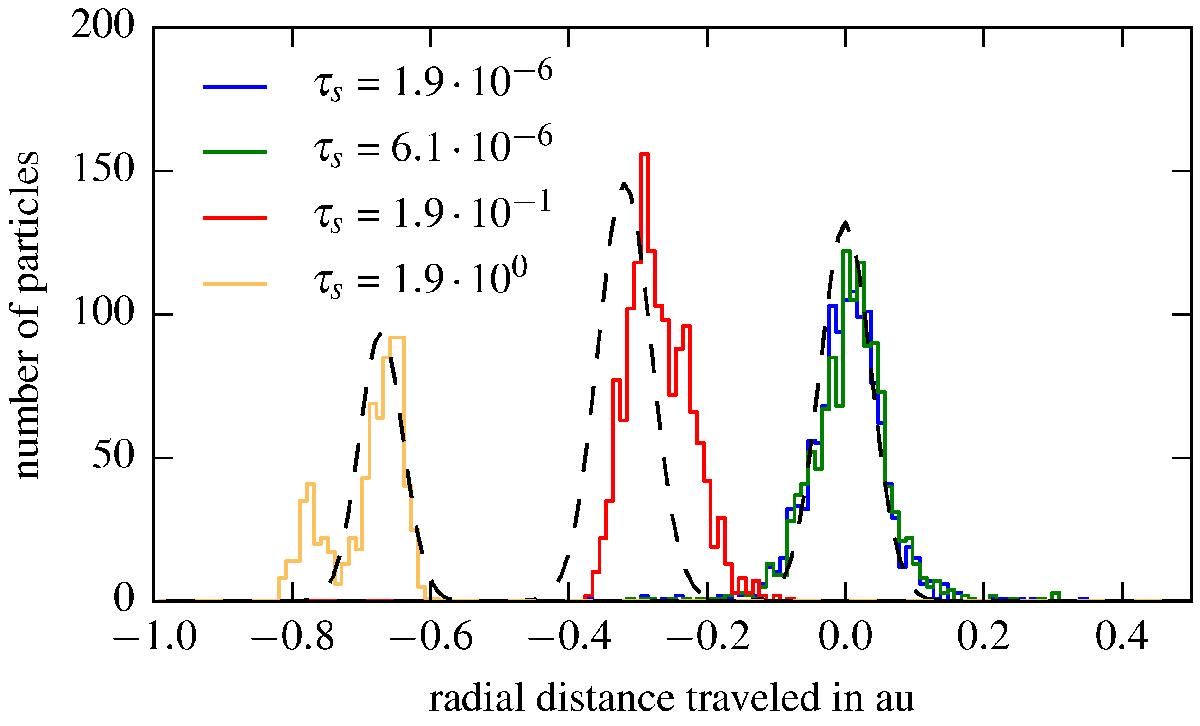
Radial particle diffusion over 100 yr, after 1000 yr. The black dashed lines are calculated from theory for the different stopping times and with τeddy = 0.1 and ![]() , see Eq. (12).
, see Eq. (12).
Current usage metrics show cumulative count of Article Views (full-text article views including HTML views, PDF and ePub downloads, according to the available data) and Abstracts Views on Vision4Press platform.
Data correspond to usage on the plateform after 2015. The current usage metrics is available 48-96 hours after online publication and is updated daily on week days.
Initial download of the metrics may take a while.