Free Access
Fig. 10
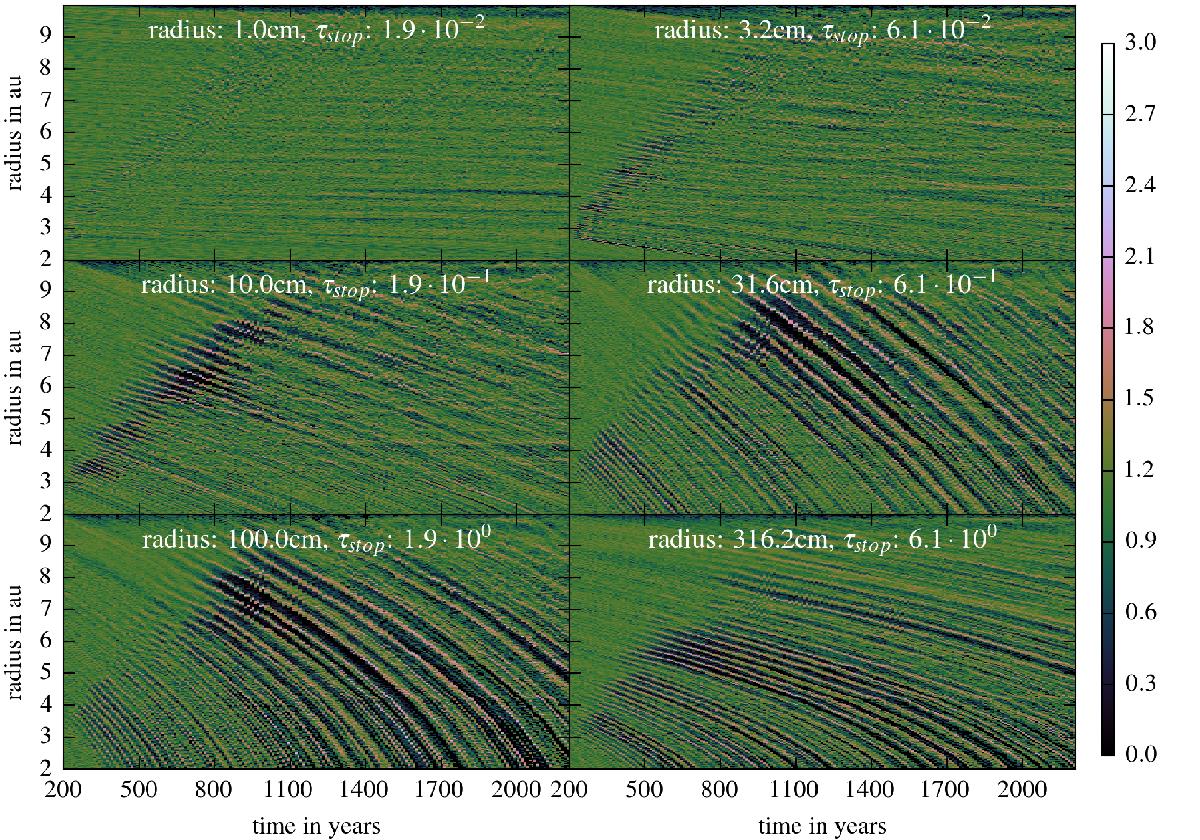
Visualisation of the radial drift of the particles. We show the logarithm with base 10 of the number of particles per bin. One can see the clumping behaviour as the VSI growths, but also the velocity of the particles.
Current usage metrics show cumulative count of Article Views (full-text article views including HTML views, PDF and ePub downloads, according to the available data) and Abstracts Views on Vision4Press platform.
Data correspond to usage on the plateform after 2015. The current usage metrics is available 48-96 hours after online publication and is updated daily on week days.
Initial download of the metrics may take a while.