Fig. 4
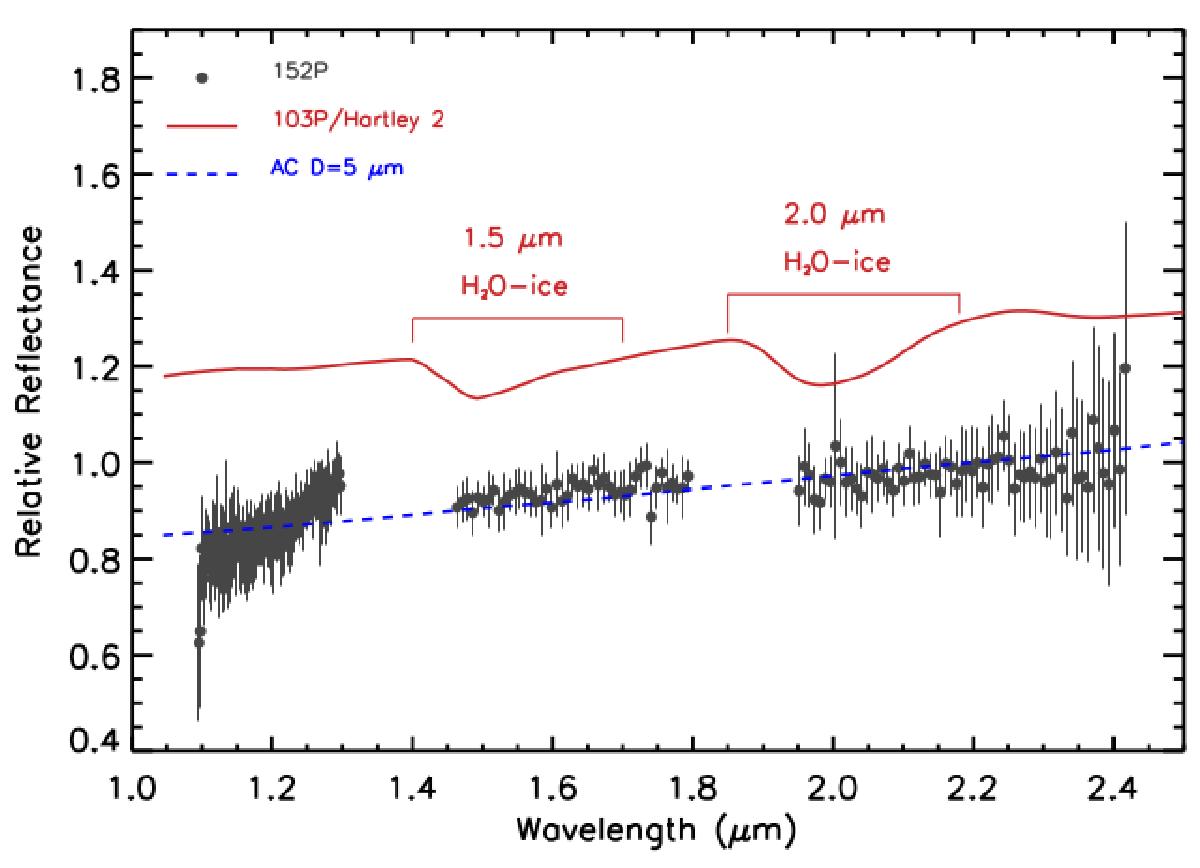
Relative reflectance spectrum of comet 152P (grey dots). For comparison, a synthetic spectrum of amorphous carbon (AC) grains (particle diameter of 5 μm, blue line) and the synthetic spectrum used to represent the Hartley 2 coma (solid red line) composed of 1 μm water-ice grains and dust not in thermal equilibrium (Protopapa et al. 2014).
Current usage metrics show cumulative count of Article Views (full-text article views including HTML views, PDF and ePub downloads, according to the available data) and Abstracts Views on Vision4Press platform.
Data correspond to usage on the plateform after 2015. The current usage metrics is available 48-96 hours after online publication and is updated daily on week days.
Initial download of the metrics may take a while.