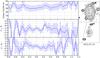
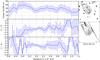
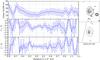
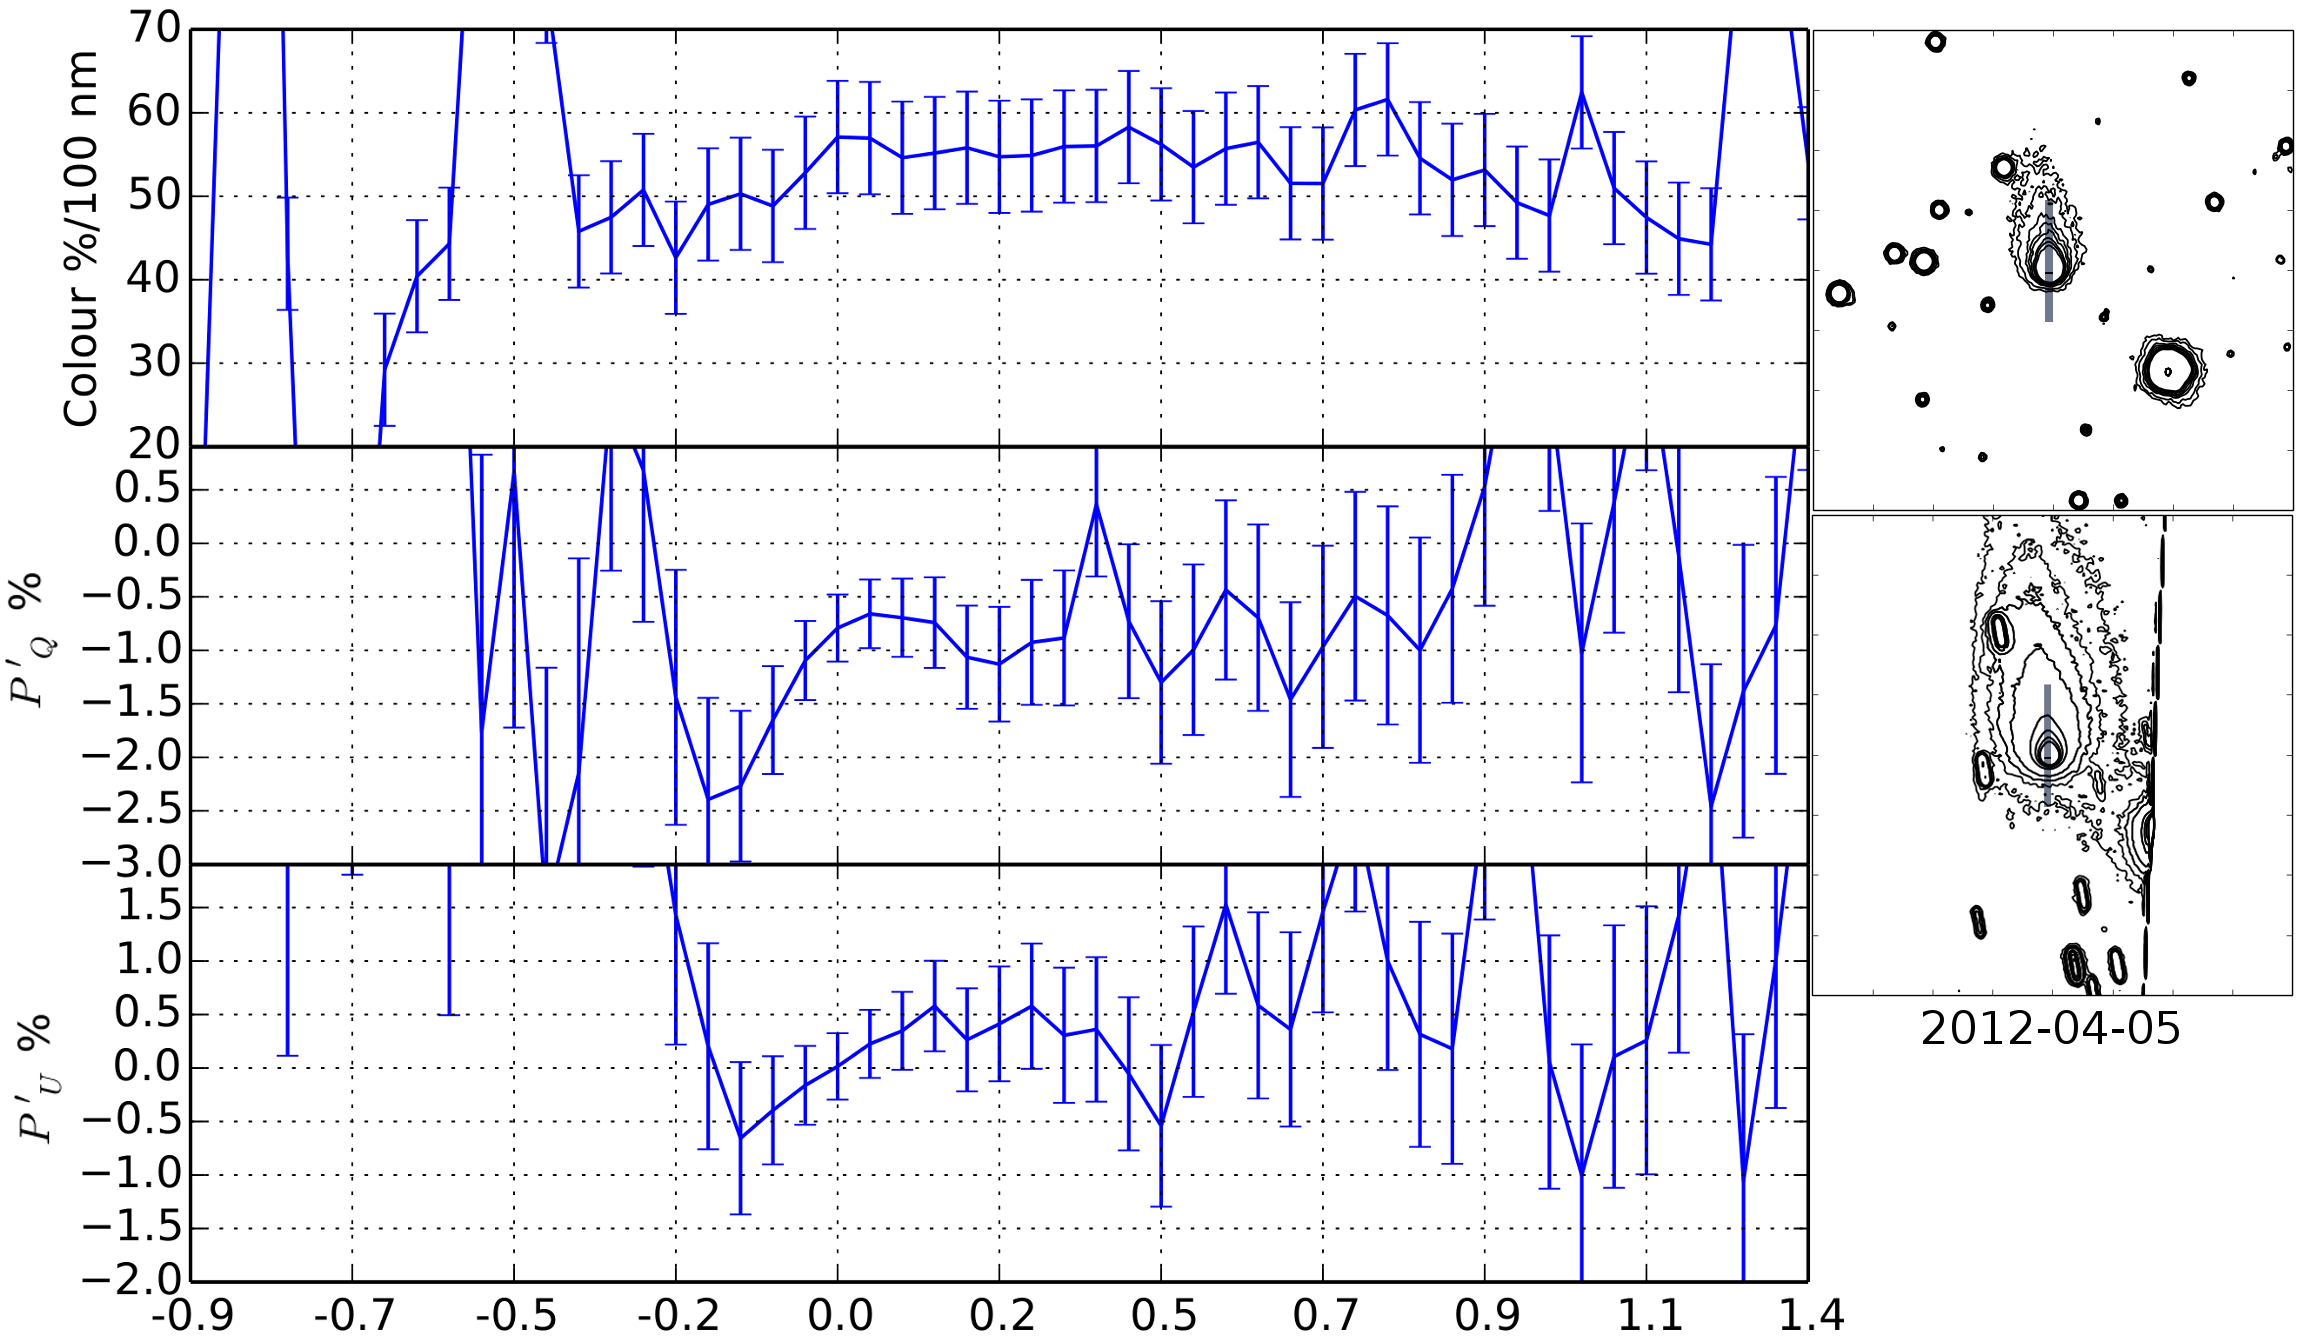
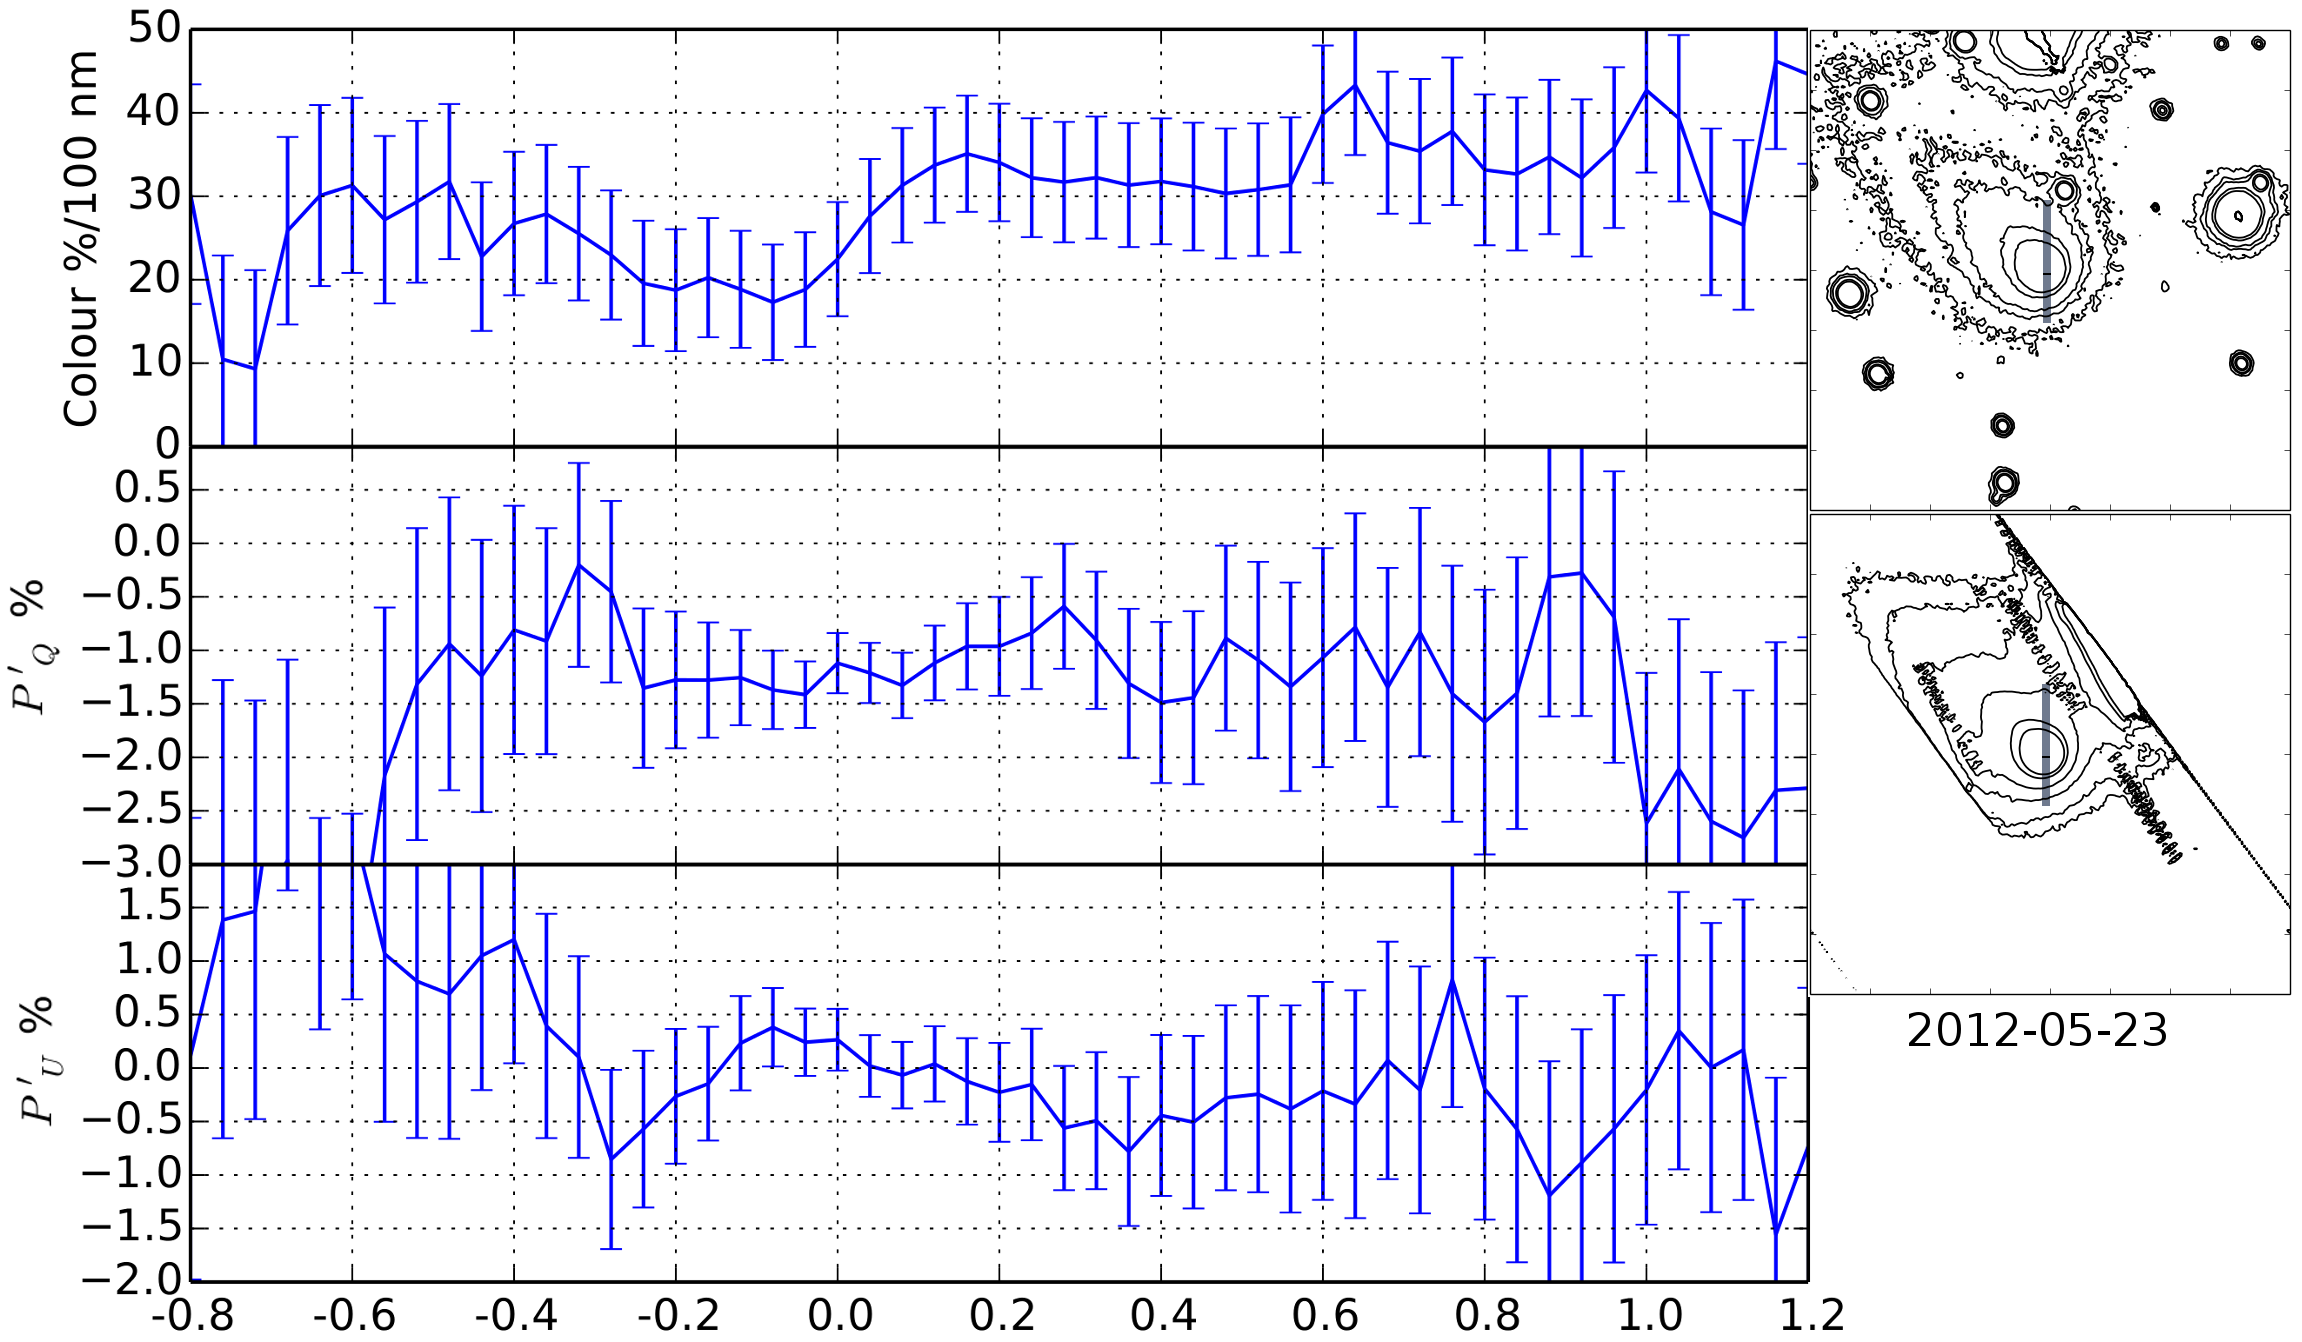
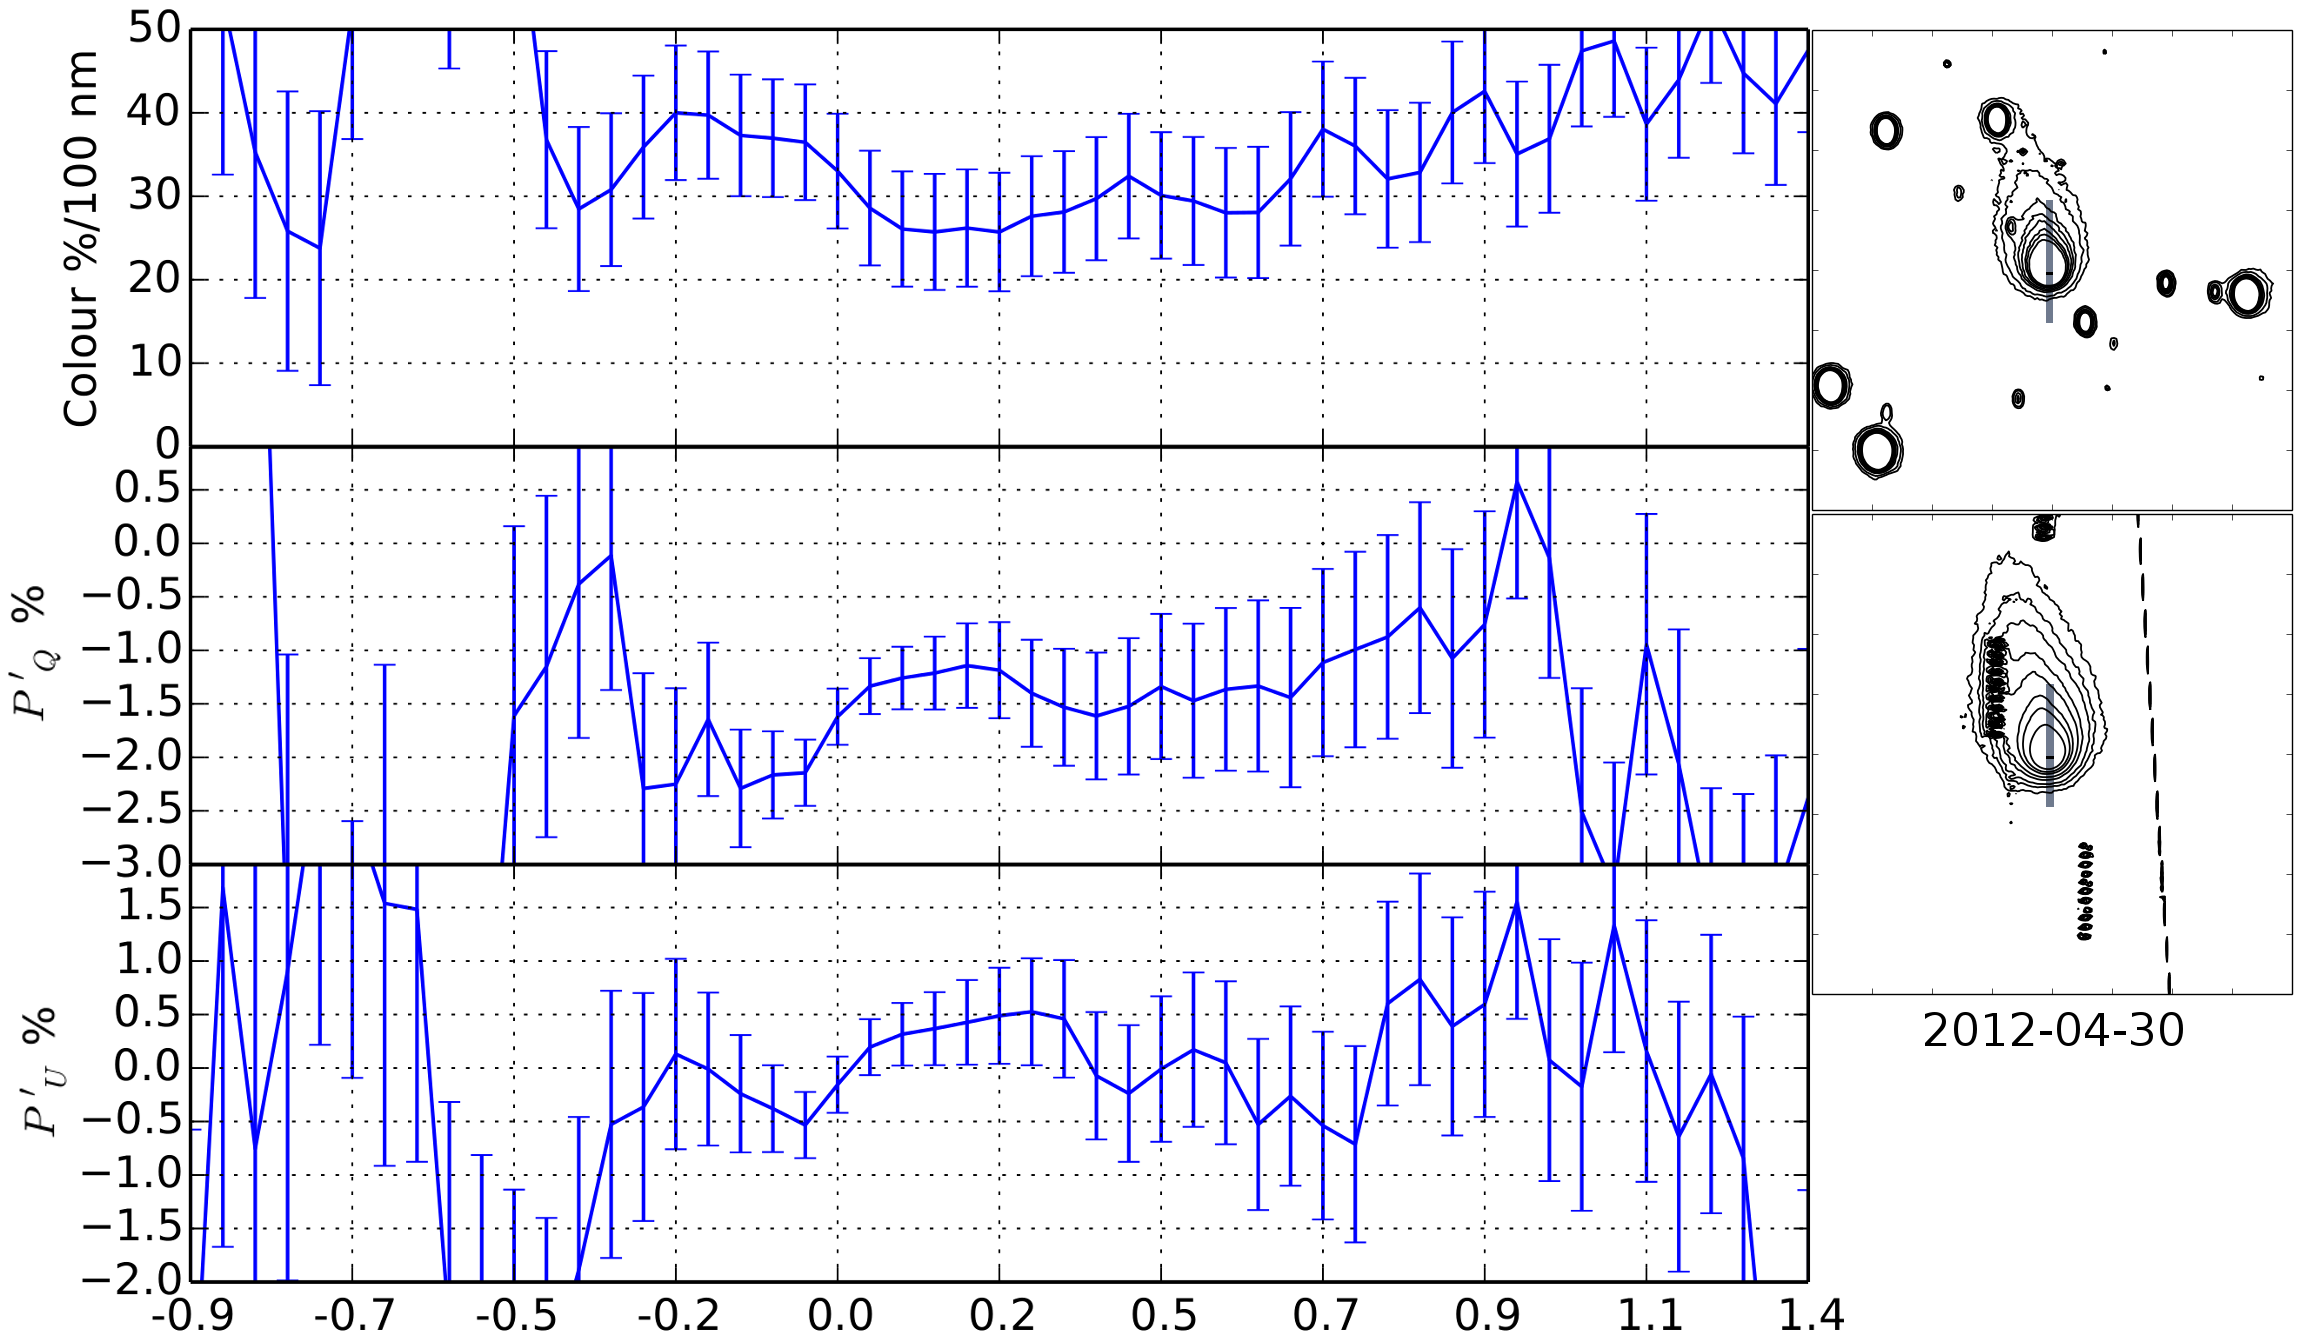
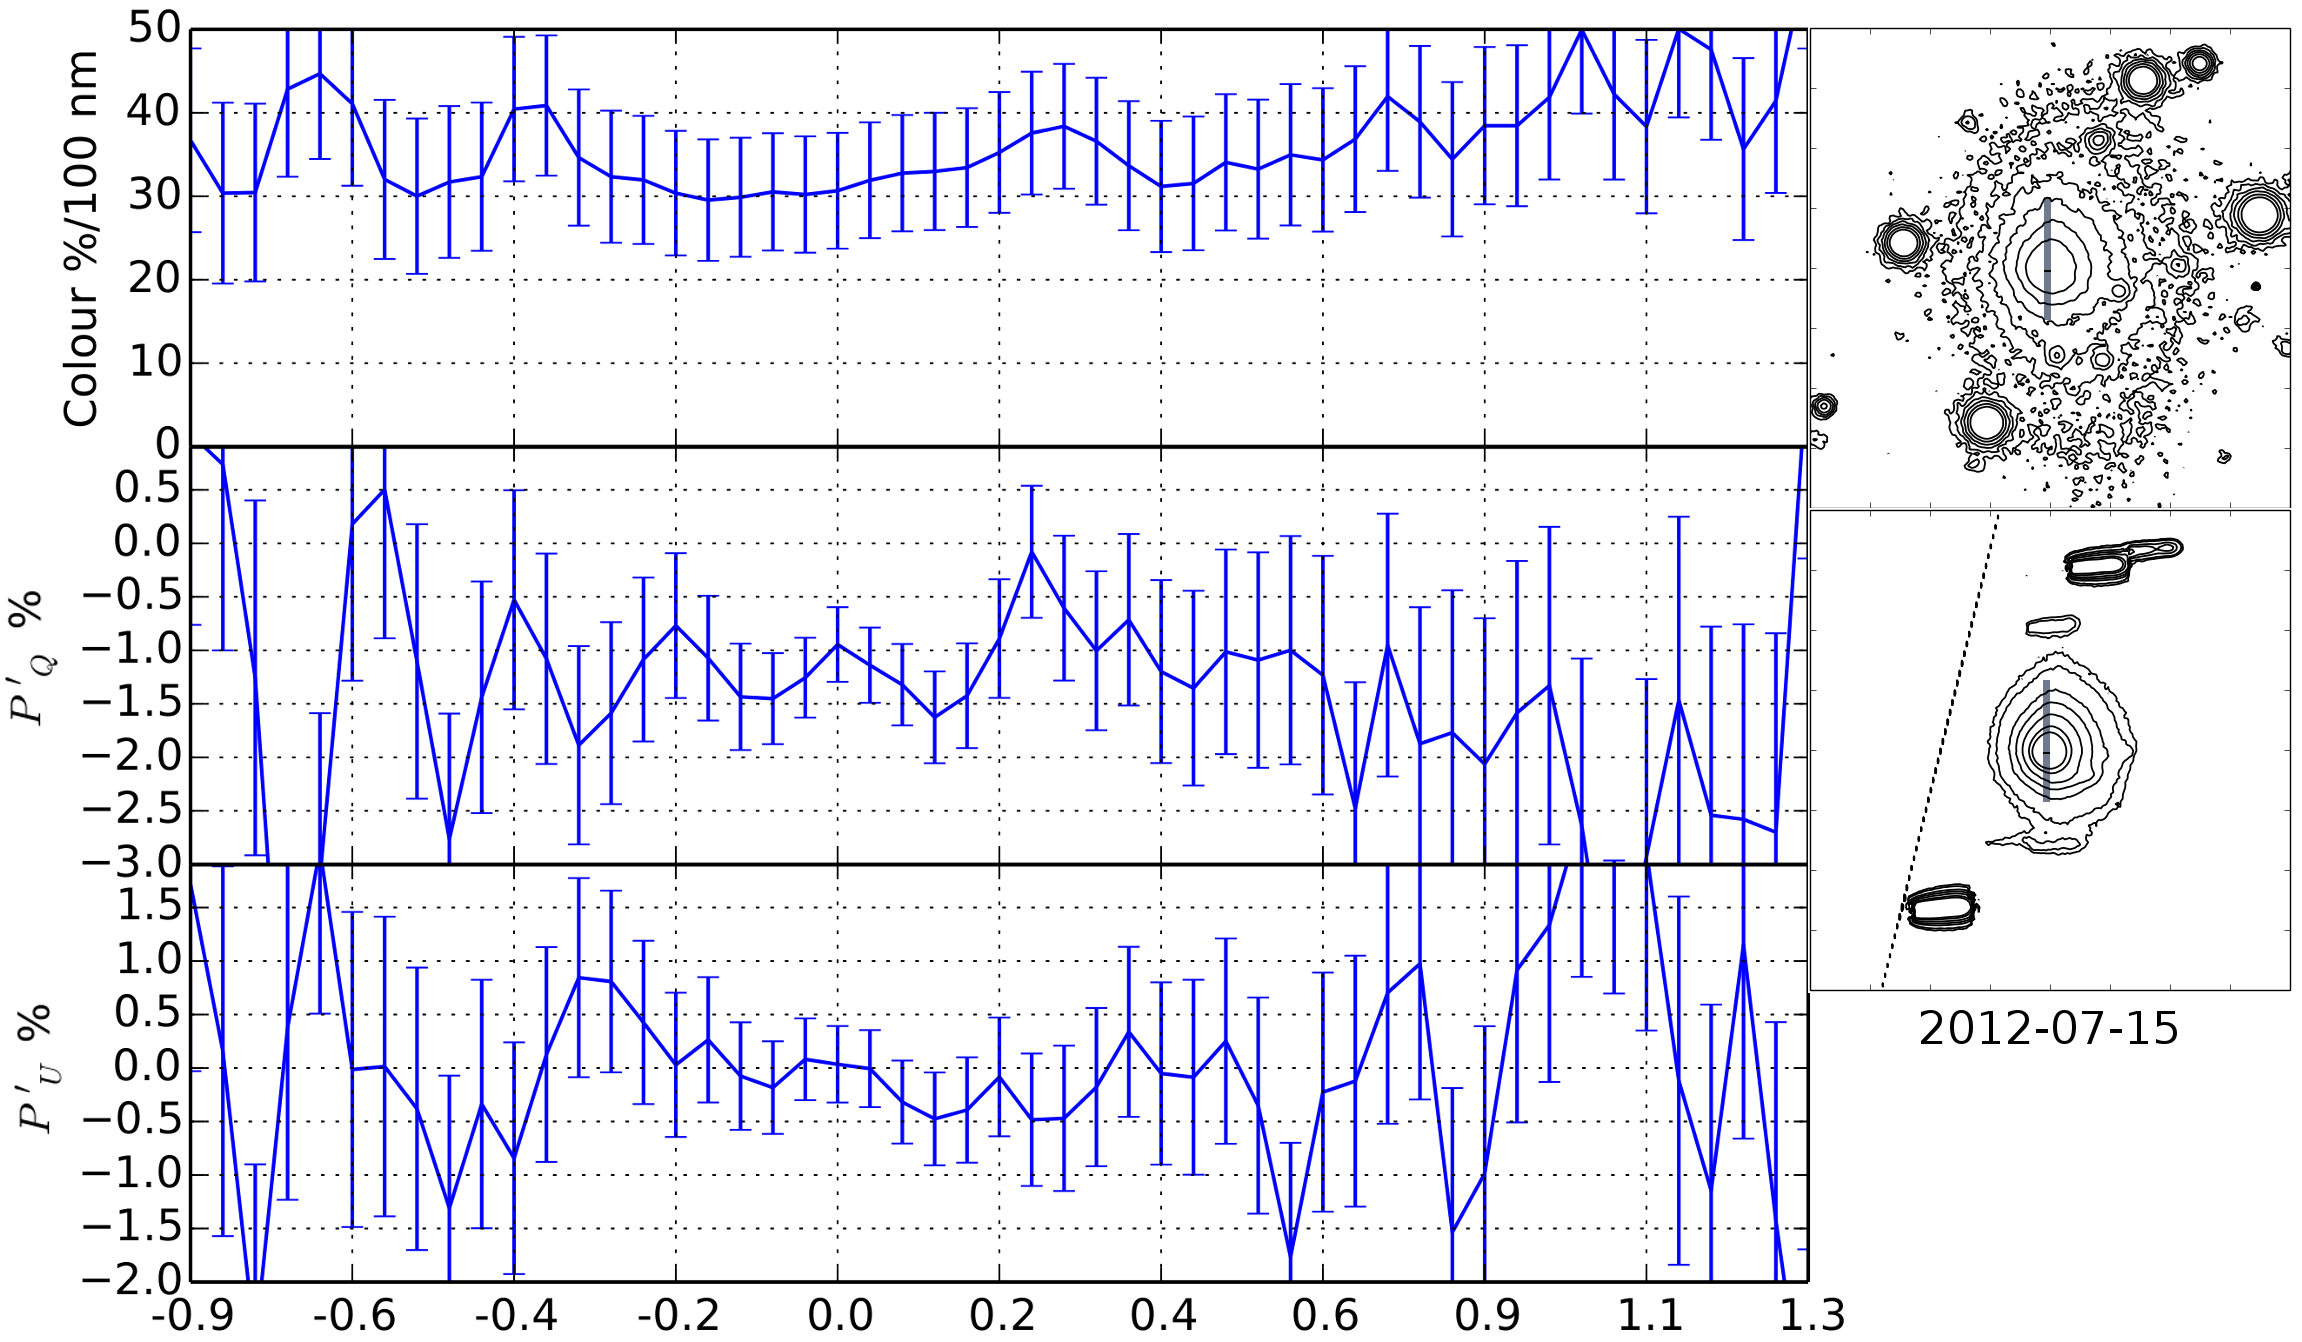
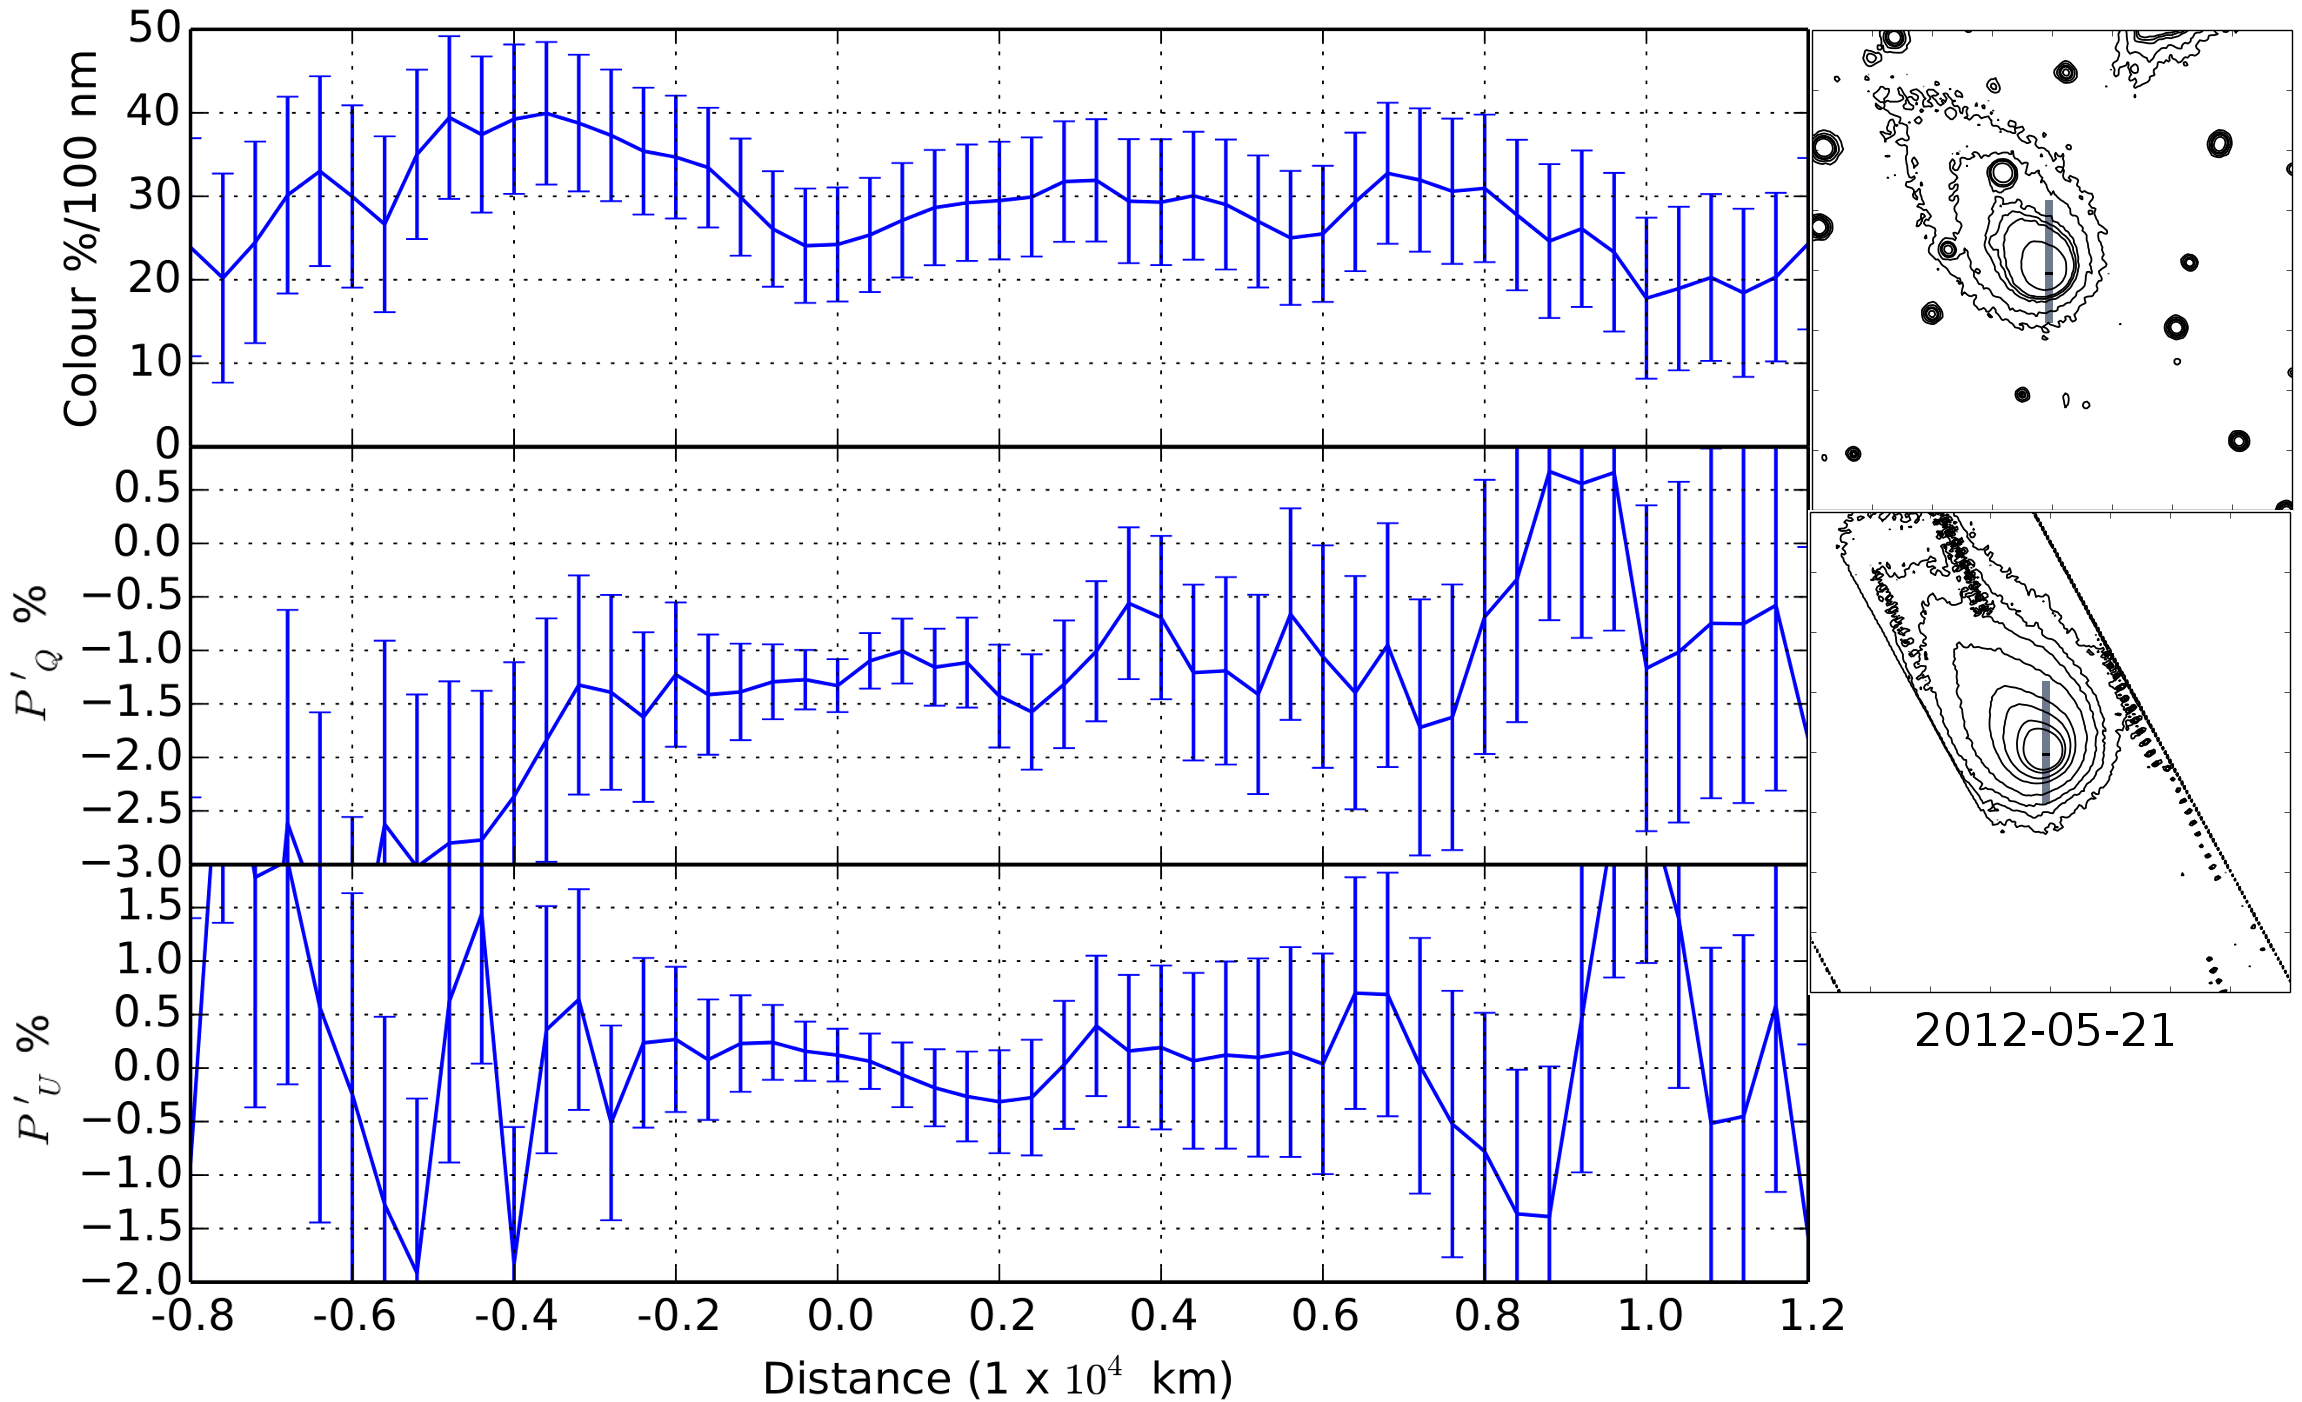
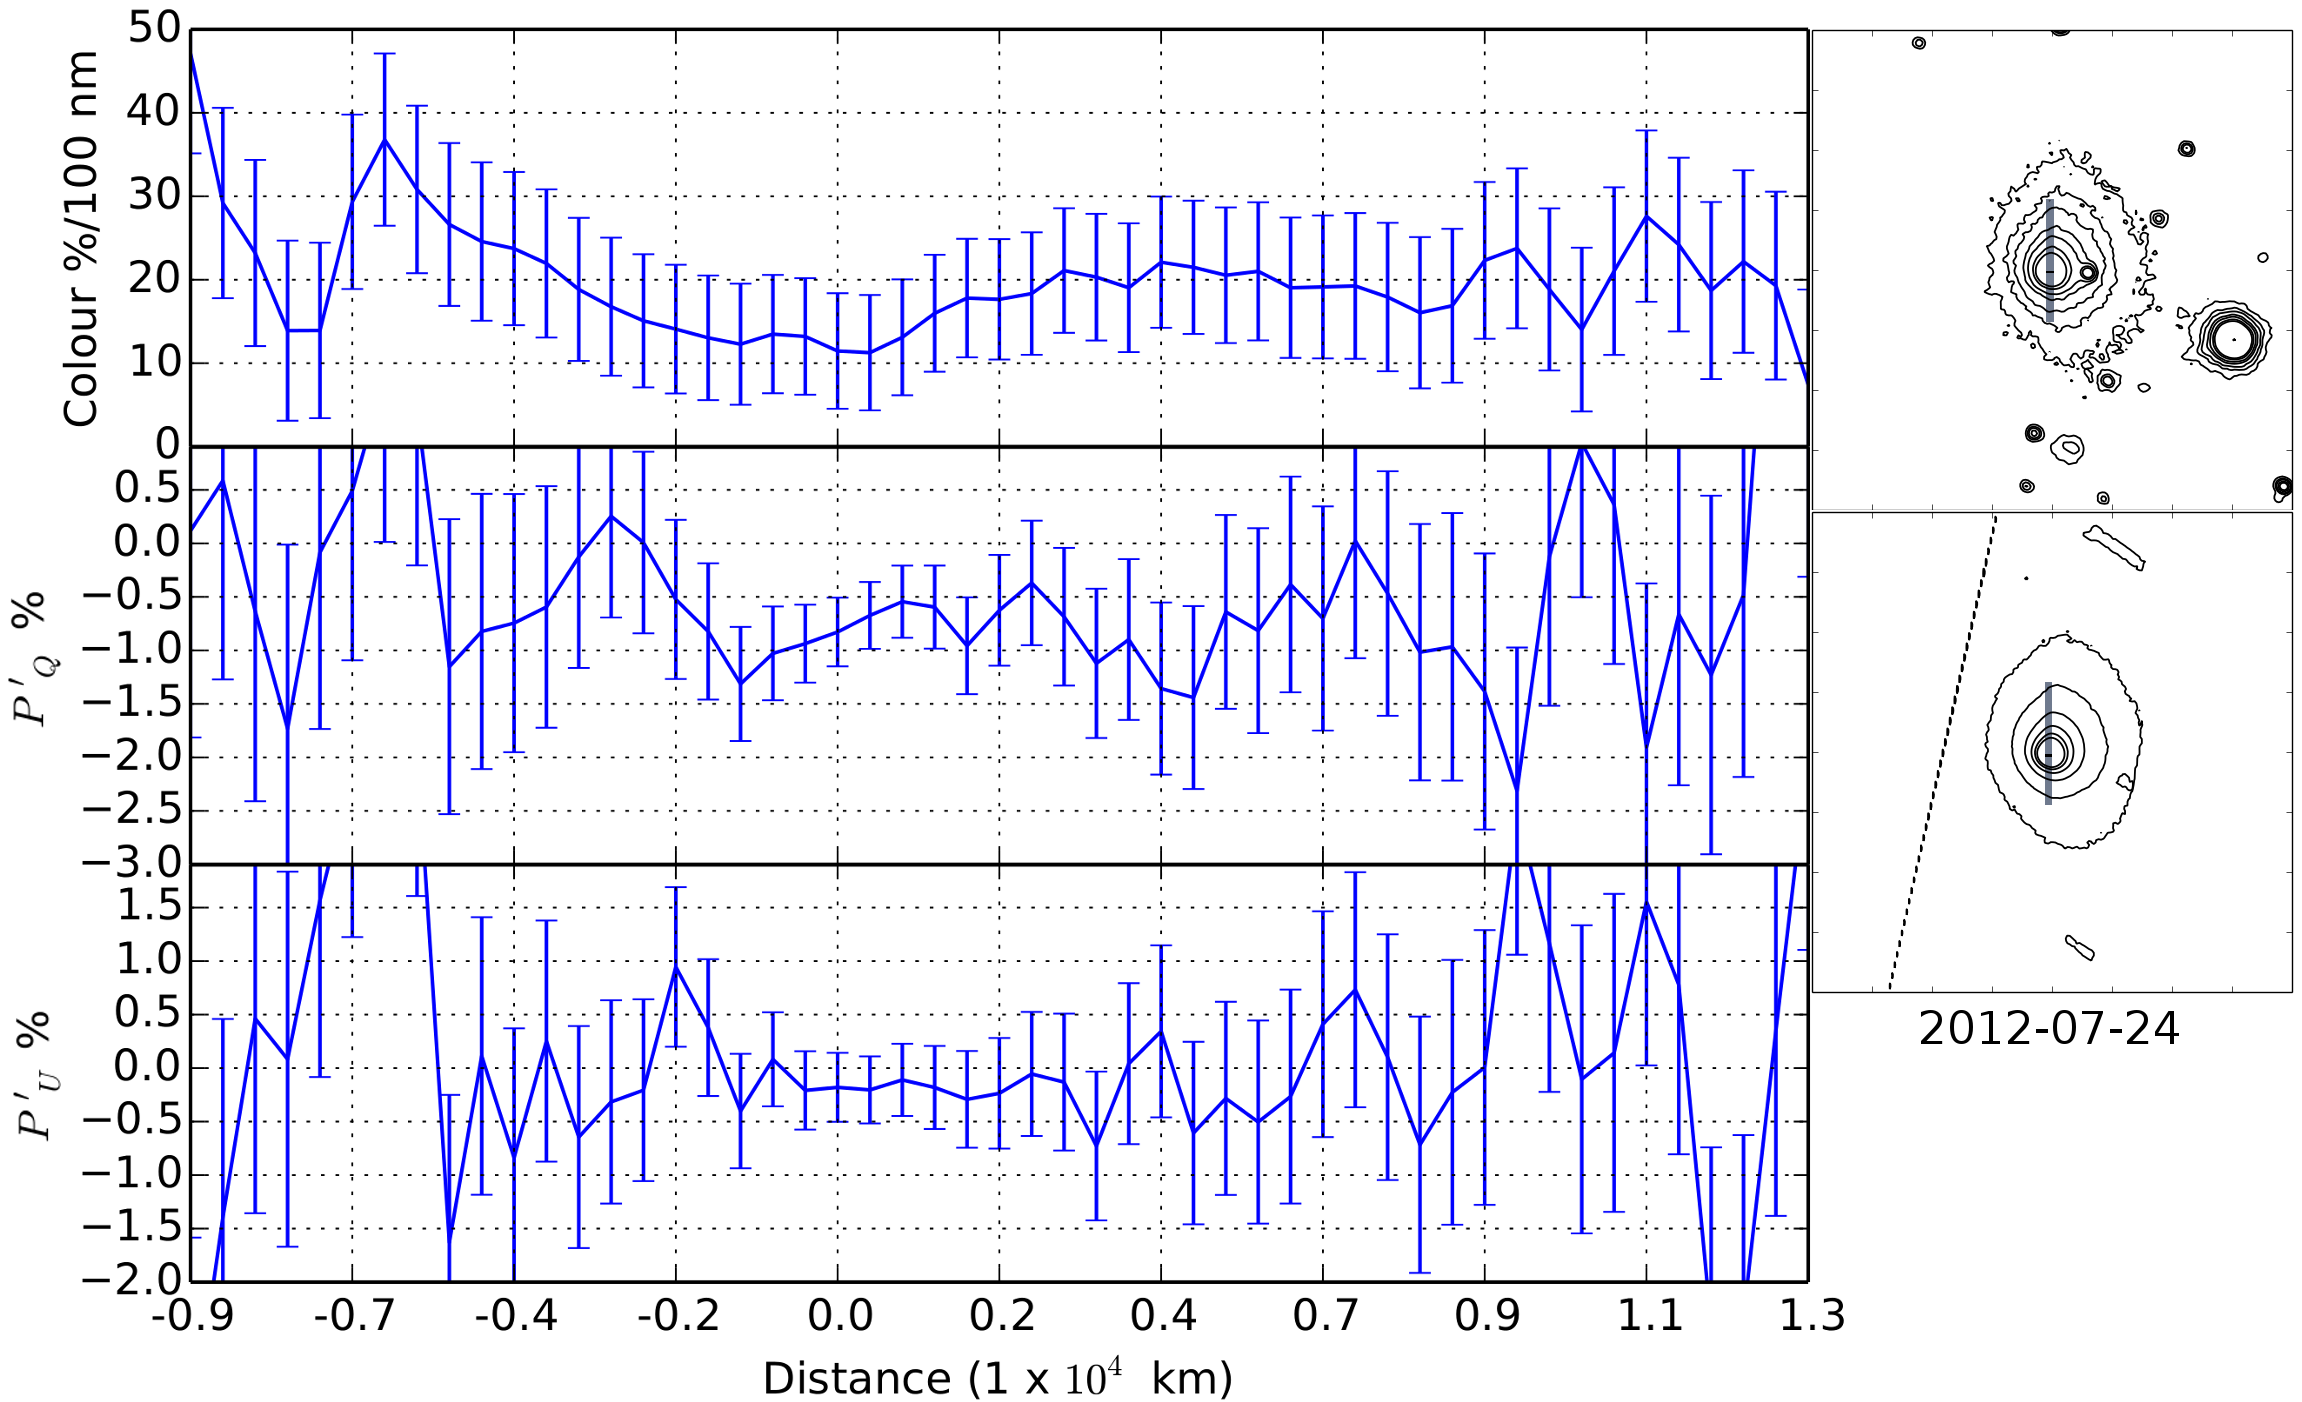
Fig. 13
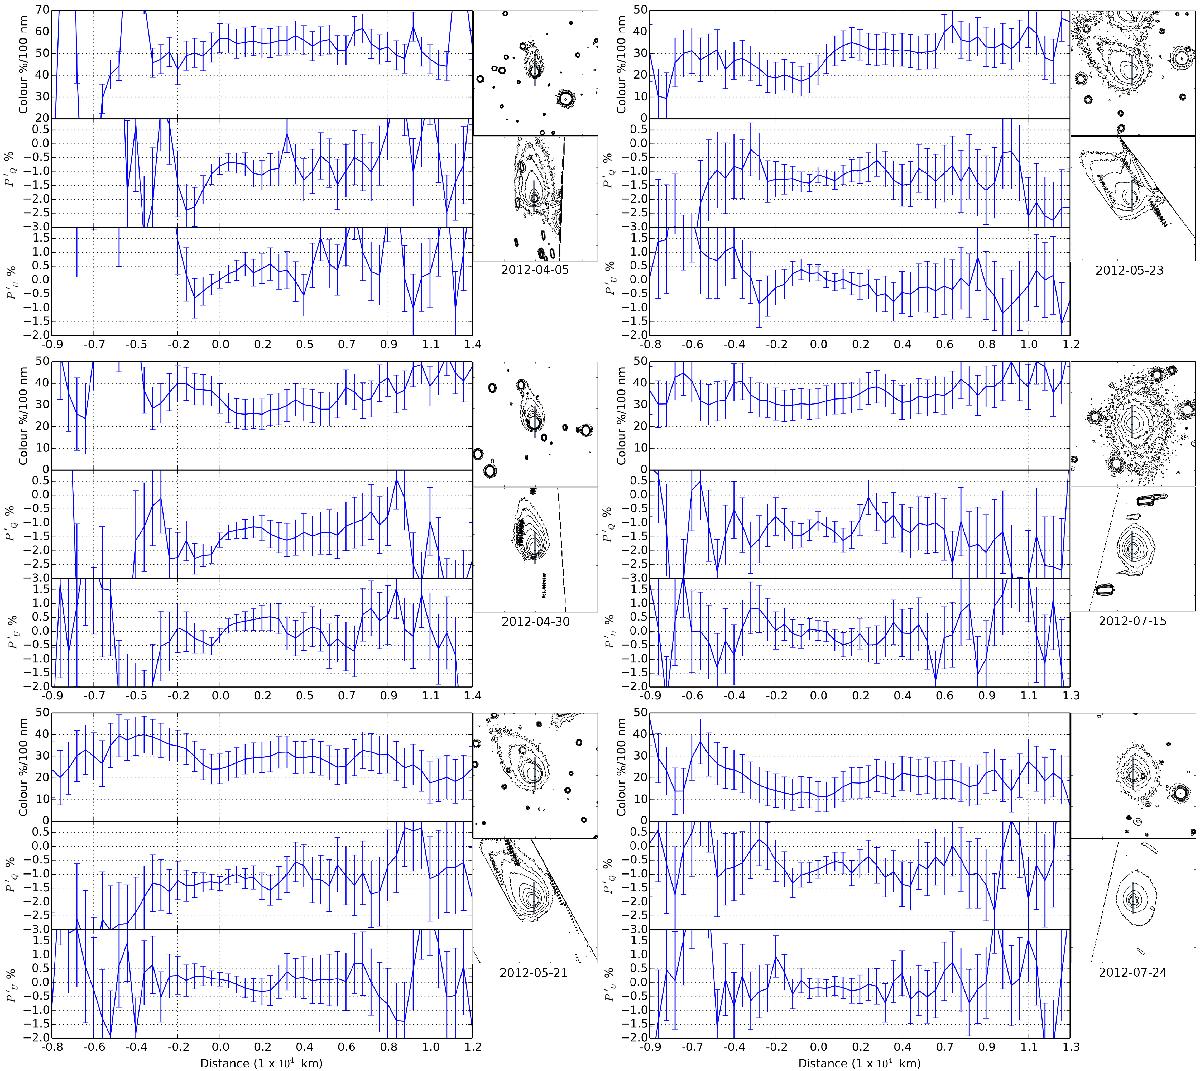
Scans of the comet 152P colour, ![]() , and
, and ![]() along the solar anti-solar direction. Positive distance is in the anti-solar direction, and negative distance is in the solar direction. Zero is at the photometric centre of the comet. The upper contour plot shows the intensity of the comet in the photometric images and the lower contour plot shows the photometric intensity of the comet in the polarimetric images; the levels are arbitrary. The small grey shaded area in each contour plot shows the area scanned.
along the solar anti-solar direction. Positive distance is in the anti-solar direction, and negative distance is in the solar direction. Zero is at the photometric centre of the comet. The upper contour plot shows the intensity of the comet in the photometric images and the lower contour plot shows the photometric intensity of the comet in the polarimetric images; the levels are arbitrary. The small grey shaded area in each contour plot shows the area scanned.
Current usage metrics show cumulative count of Article Views (full-text article views including HTML views, PDF and ePub downloads, according to the available data) and Abstracts Views on Vision4Press platform.
Data correspond to usage on the plateform after 2015. The current usage metrics is available 48-96 hours after online publication and is updated daily on week days.
Initial download of the metrics may take a while.