Fig. 5
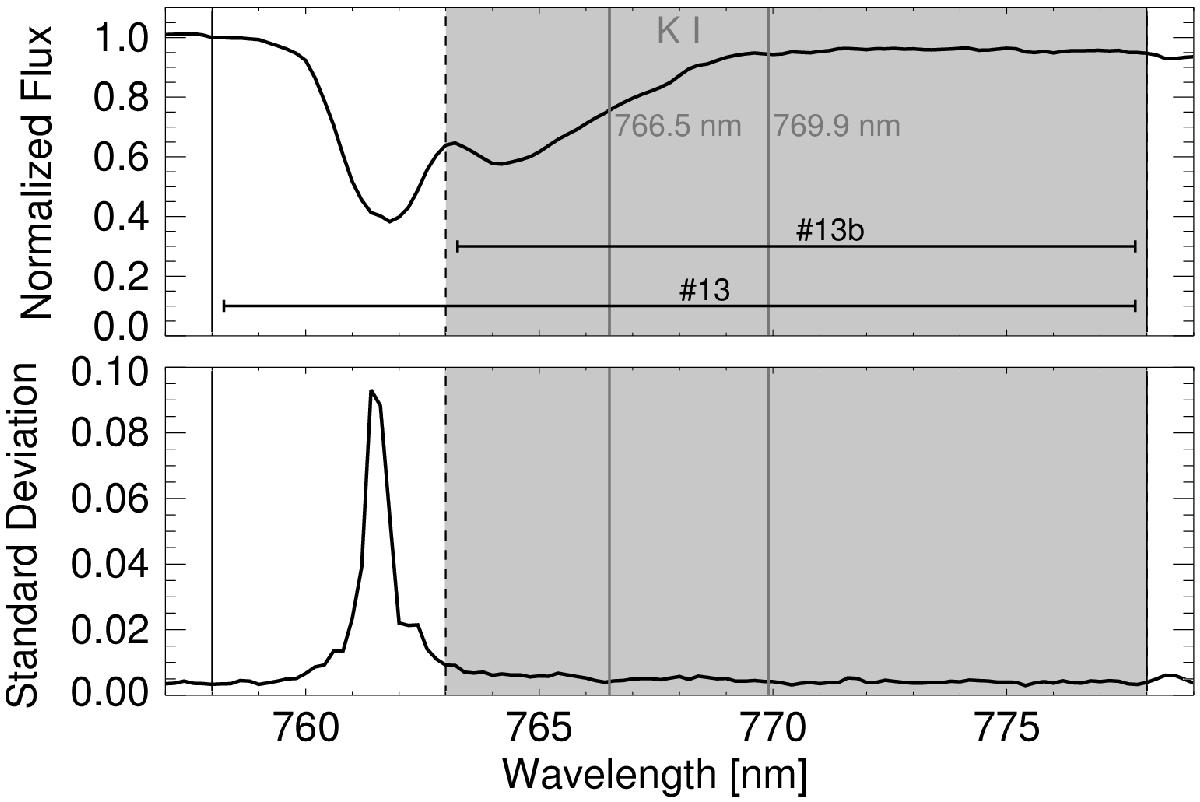
Definition of narrowband channel #13b as a subchannel of channel #13. The gray shaded area encompasses the predicted K i resonance lines but avoids the high noise region caused by telluric oxygen absorption. Top panel: example spectrum of Ref2 within the limits of narrowband channel #13, showing the significant flux decrease in the telluric oxygen. Bottom panel: noise level at each wavelength as estimated from the after transit light curve standard deviation showing a strong increase of noise in the stronger telluric oxygen absorption band.
Current usage metrics show cumulative count of Article Views (full-text article views including HTML views, PDF and ePub downloads, according to the available data) and Abstracts Views on Vision4Press platform.
Data correspond to usage on the plateform after 2015. The current usage metrics is available 48-96 hours after online publication and is updated daily on week days.
Initial download of the metrics may take a while.