Free Access
Fig. 3
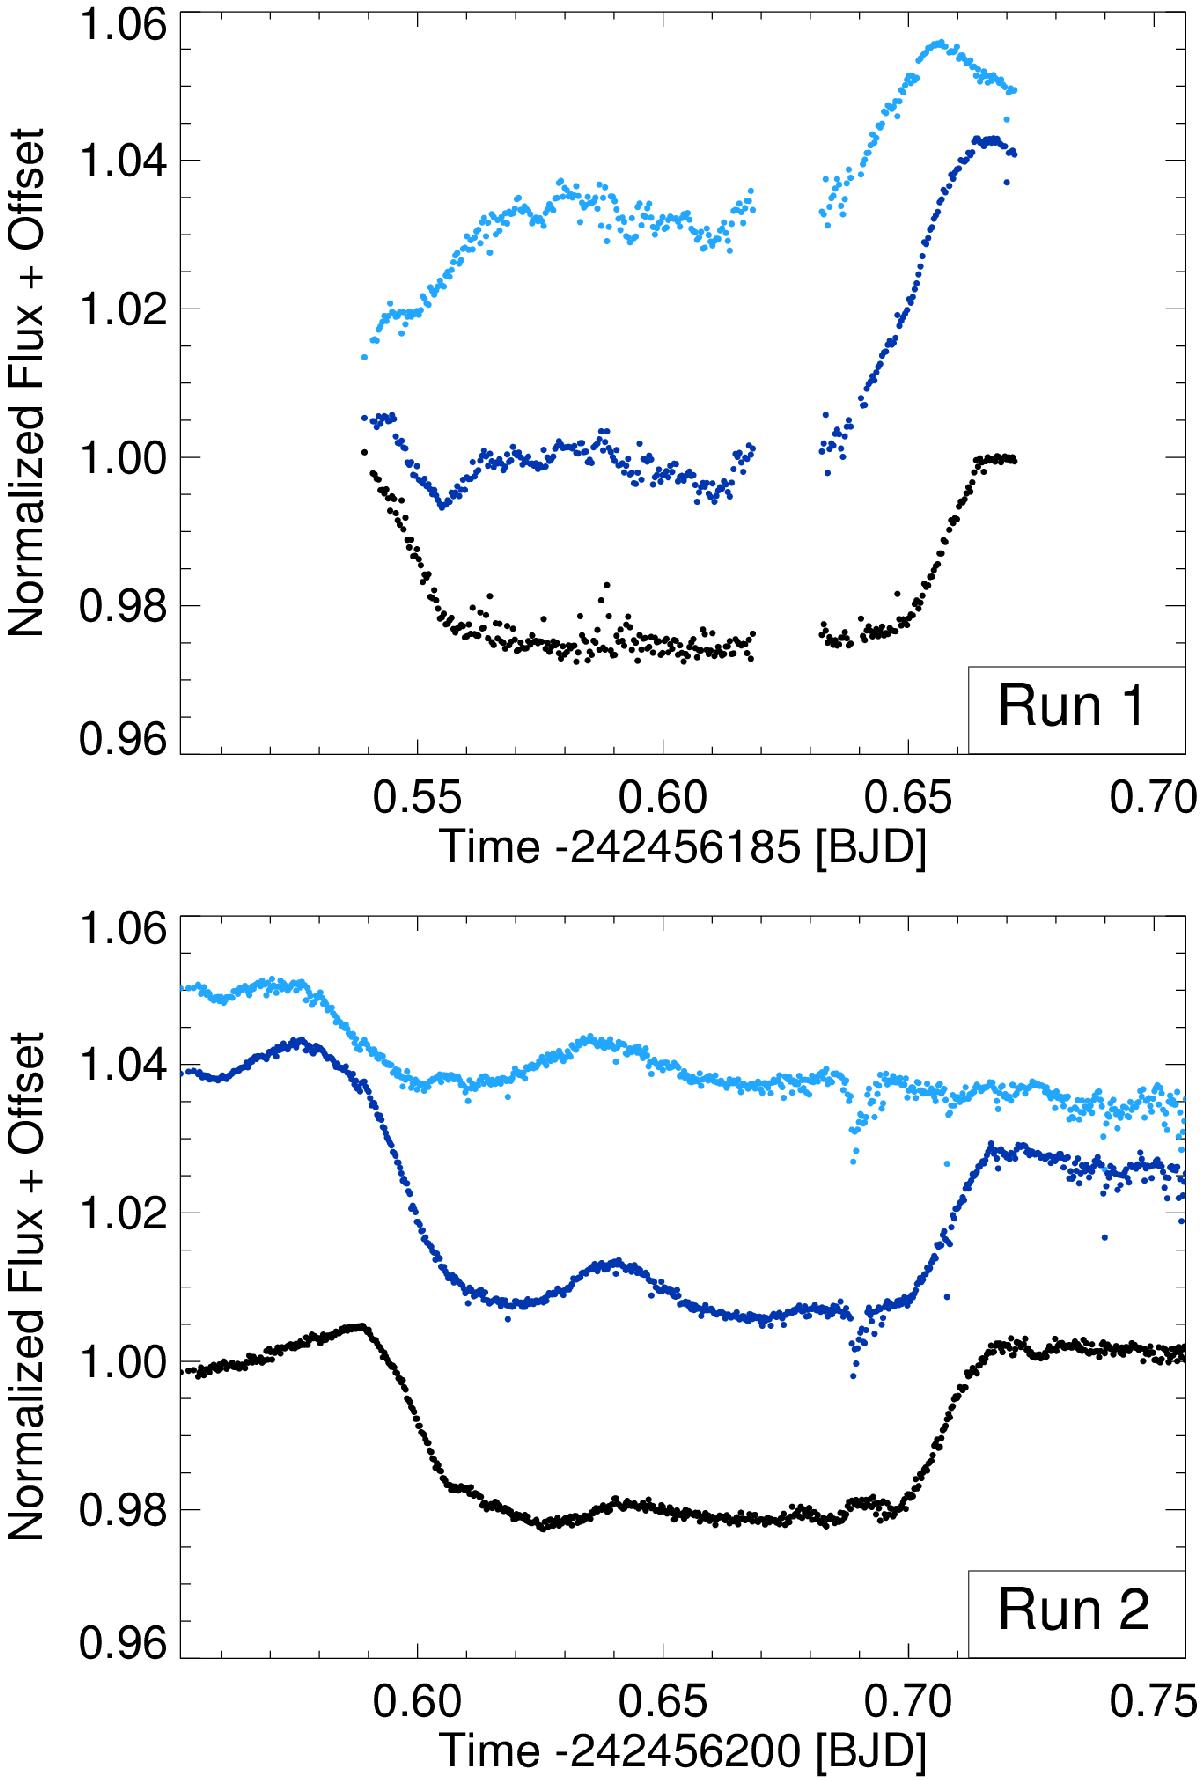
Raw white light curves for HAT-P-32A (dark gray circles) and the reference star (light gray circles) for both observing runs and their division the relative white light curve (black circles). Top panel: data for Run 1, bottom panel: data for Run 2.
Current usage metrics show cumulative count of Article Views (full-text article views including HTML views, PDF and ePub downloads, according to the available data) and Abstracts Views on Vision4Press platform.
Data correspond to usage on the plateform after 2015. The current usage metrics is available 48-96 hours after online publication and is updated daily on week days.
Initial download of the metrics may take a while.