Fig. A.4
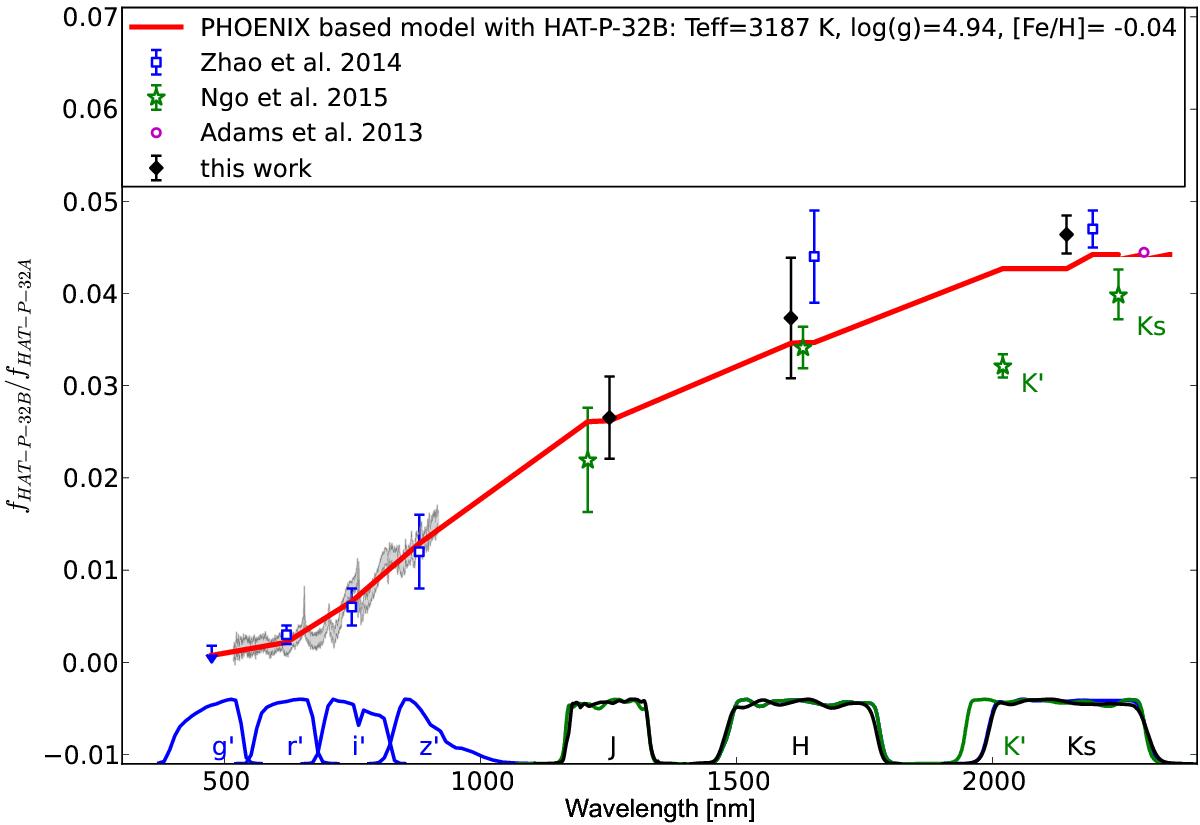
Relative optical and infrared photometry HAT-P-32B/HAT-P-32A. The results of the tree different literature studies are plotted together with our own J, H, and KS band measurements. The optical relative spectrum from Fig. A.3 is also shown in light gray to emphasize the good agreement between this result and the literature photometry. The best-fit PHOENIX model relative spectrum (same as in Fig. A.3) evaluated in the same band passes as the observations is plotted in red. The points obtained in the same or very similar band passes are plotted at slightly shifted abscissa values from the actual center of the respective band pass to increase clarity of the figure.
Current usage metrics show cumulative count of Article Views (full-text article views including HTML views, PDF and ePub downloads, according to the available data) and Abstracts Views on Vision4Press platform.
Data correspond to usage on the plateform after 2015. The current usage metrics is available 48-96 hours after online publication and is updated daily on week days.
Initial download of the metrics may take a while.