Free Access
Fig. A.3
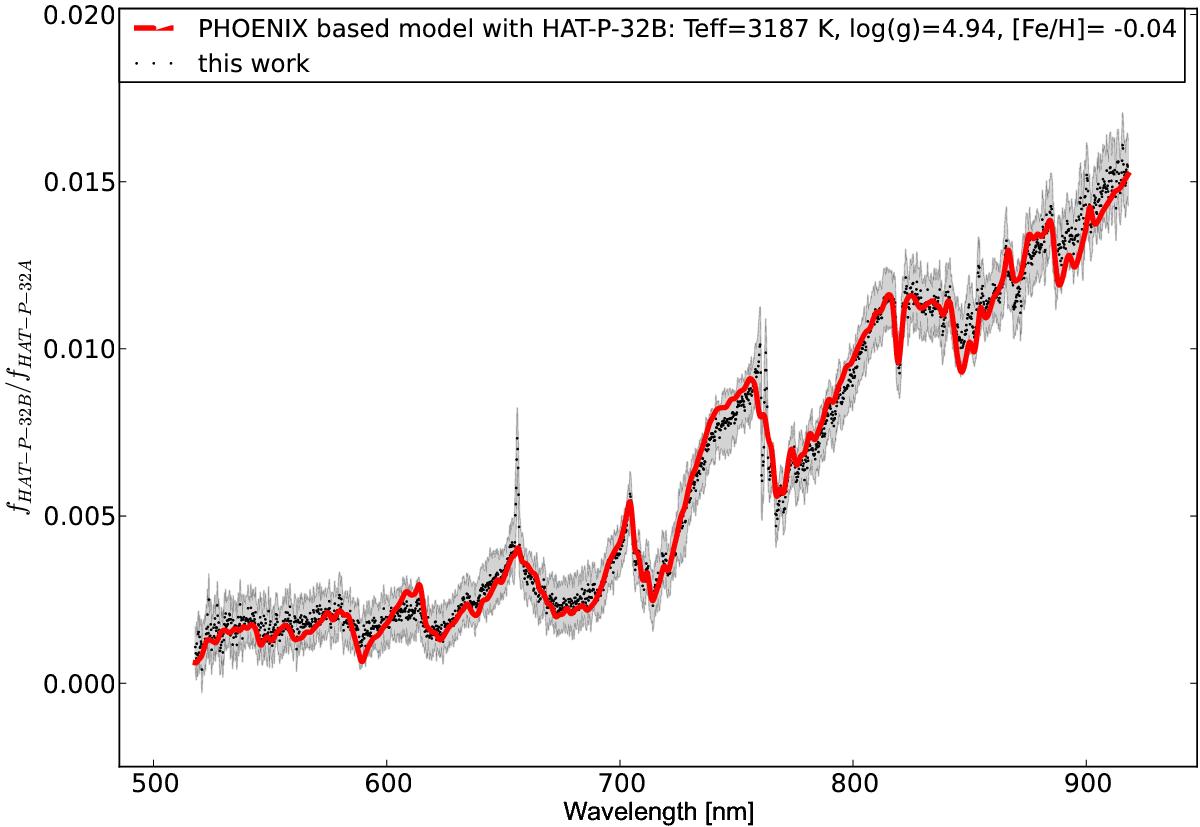
Relative optical spectrum HAT-P-32B/HAT-P-32A. The data is plotted as points, the 1σ uncertainty intervals are given as a light gray shaded area. The best-fit PHOENIX model relative spectrum is given in red and relies on fixing the stellar properties of HAT-P-32A on literature values.
Current usage metrics show cumulative count of Article Views (full-text article views including HTML views, PDF and ePub downloads, according to the available data) and Abstracts Views on Vision4Press platform.
Data correspond to usage on the plateform after 2015. The current usage metrics is available 48-96 hours after online publication and is updated daily on week days.
Initial download of the metrics may take a while.