Fig. A.1
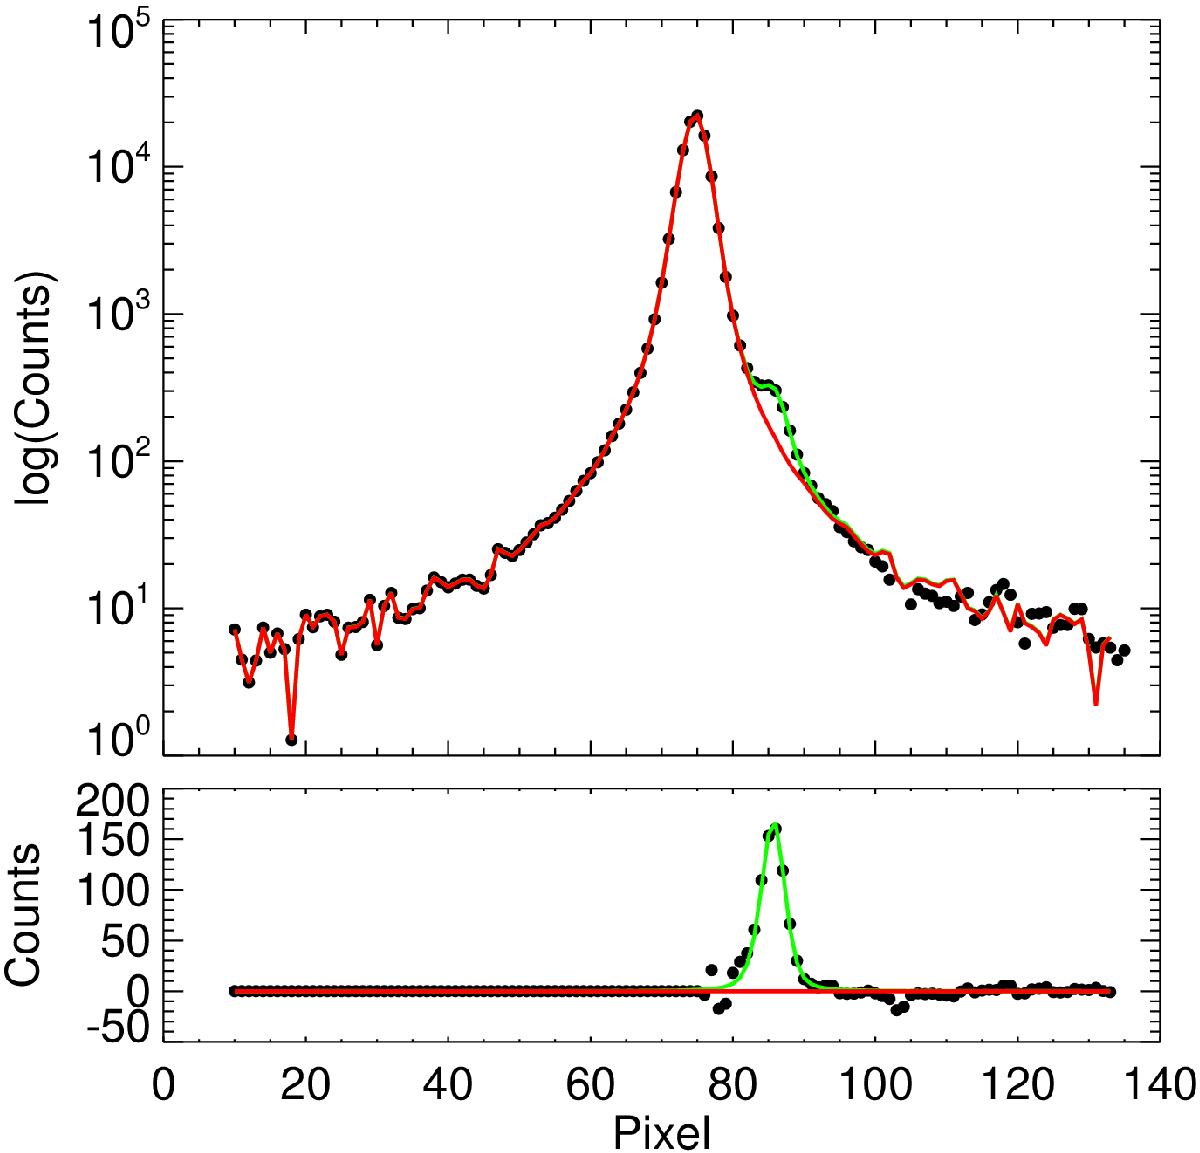
Top panel: example for the combined stellar profiles of HAT-P-32A and HAT-P-32B plotted in semi logarithmic scale. In red the empirical model profile for HAT-P-32A is shown. The green line indicates where the combined profile diverges from HAT-P-32A’s profile. Bottom panel: same data as in top panel after subtraction of the empirical model profile of HAT-P-32A. The green line now represents the model profile of HAT-P-32B.
Current usage metrics show cumulative count of Article Views (full-text article views including HTML views, PDF and ePub downloads, according to the available data) and Abstracts Views on Vision4Press platform.
Data correspond to usage on the plateform after 2015. The current usage metrics is available 48-96 hours after online publication and is updated daily on week days.
Initial download of the metrics may take a while.