Fig. 13
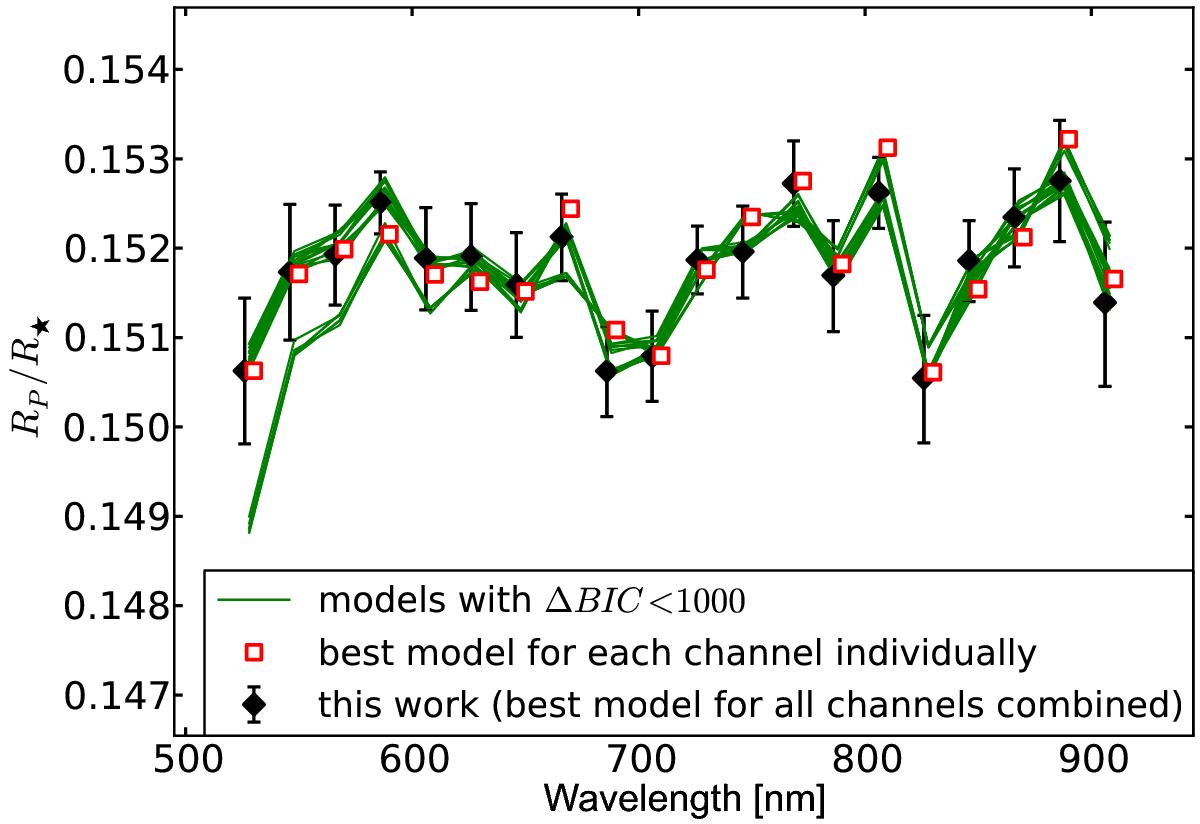
Results for the wavelength-dependent, radius ratios obtained for the different models listed in Table 4 (green lines). The final adopted results, calculated with a homogeneous analysis, are overlayed as black diamonds (error bars are calculated as described in Sect. 6). The results obtained when using the individually best-suited model for each wavelength channel are plotted as red squares.
Current usage metrics show cumulative count of Article Views (full-text article views including HTML views, PDF and ePub downloads, according to the available data) and Abstracts Views on Vision4Press platform.
Data correspond to usage on the plateform after 2015. The current usage metrics is available 48-96 hours after online publication and is updated daily on week days.
Initial download of the metrics may take a while.