Fig. 10
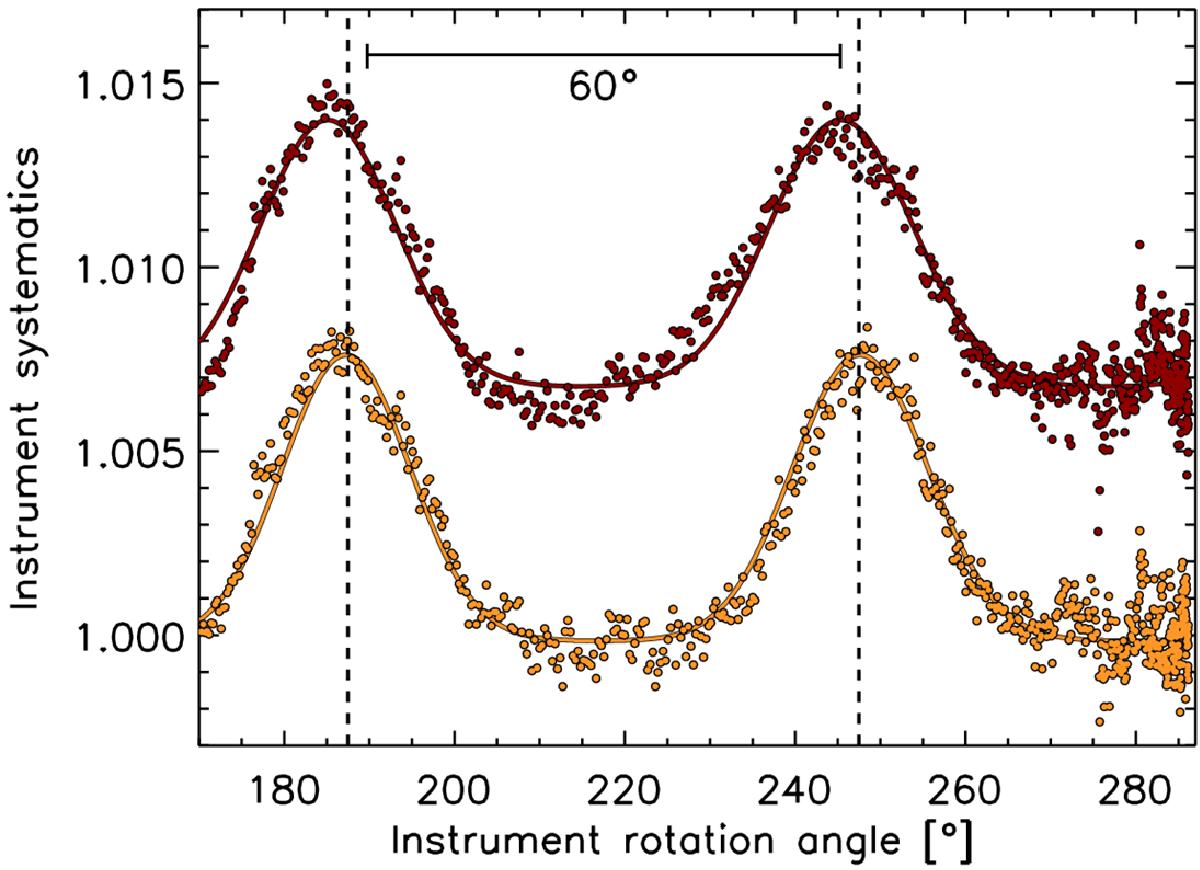
Raw white light curves of HAT-P-32Ab (yellow circles) and Ref2 (red circles) from Run 2 plotted over the instrument rotation angle for better visualization of the systematic noise signal consisting of two bump-like features. Both curves were corrected by an air mass term and the curve of HAT-P-32A was divided by a theoretical transit. For both raw light curves a rough theoretical approximation of the data consisting of a sequence of two Gaussian functions is plotted over the data (yellow and red lines).
Current usage metrics show cumulative count of Article Views (full-text article views including HTML views, PDF and ePub downloads, according to the available data) and Abstracts Views on Vision4Press platform.
Data correspond to usage on the plateform after 2015. The current usage metrics is available 48-96 hours after online publication and is updated daily on week days.
Initial download of the metrics may take a while.