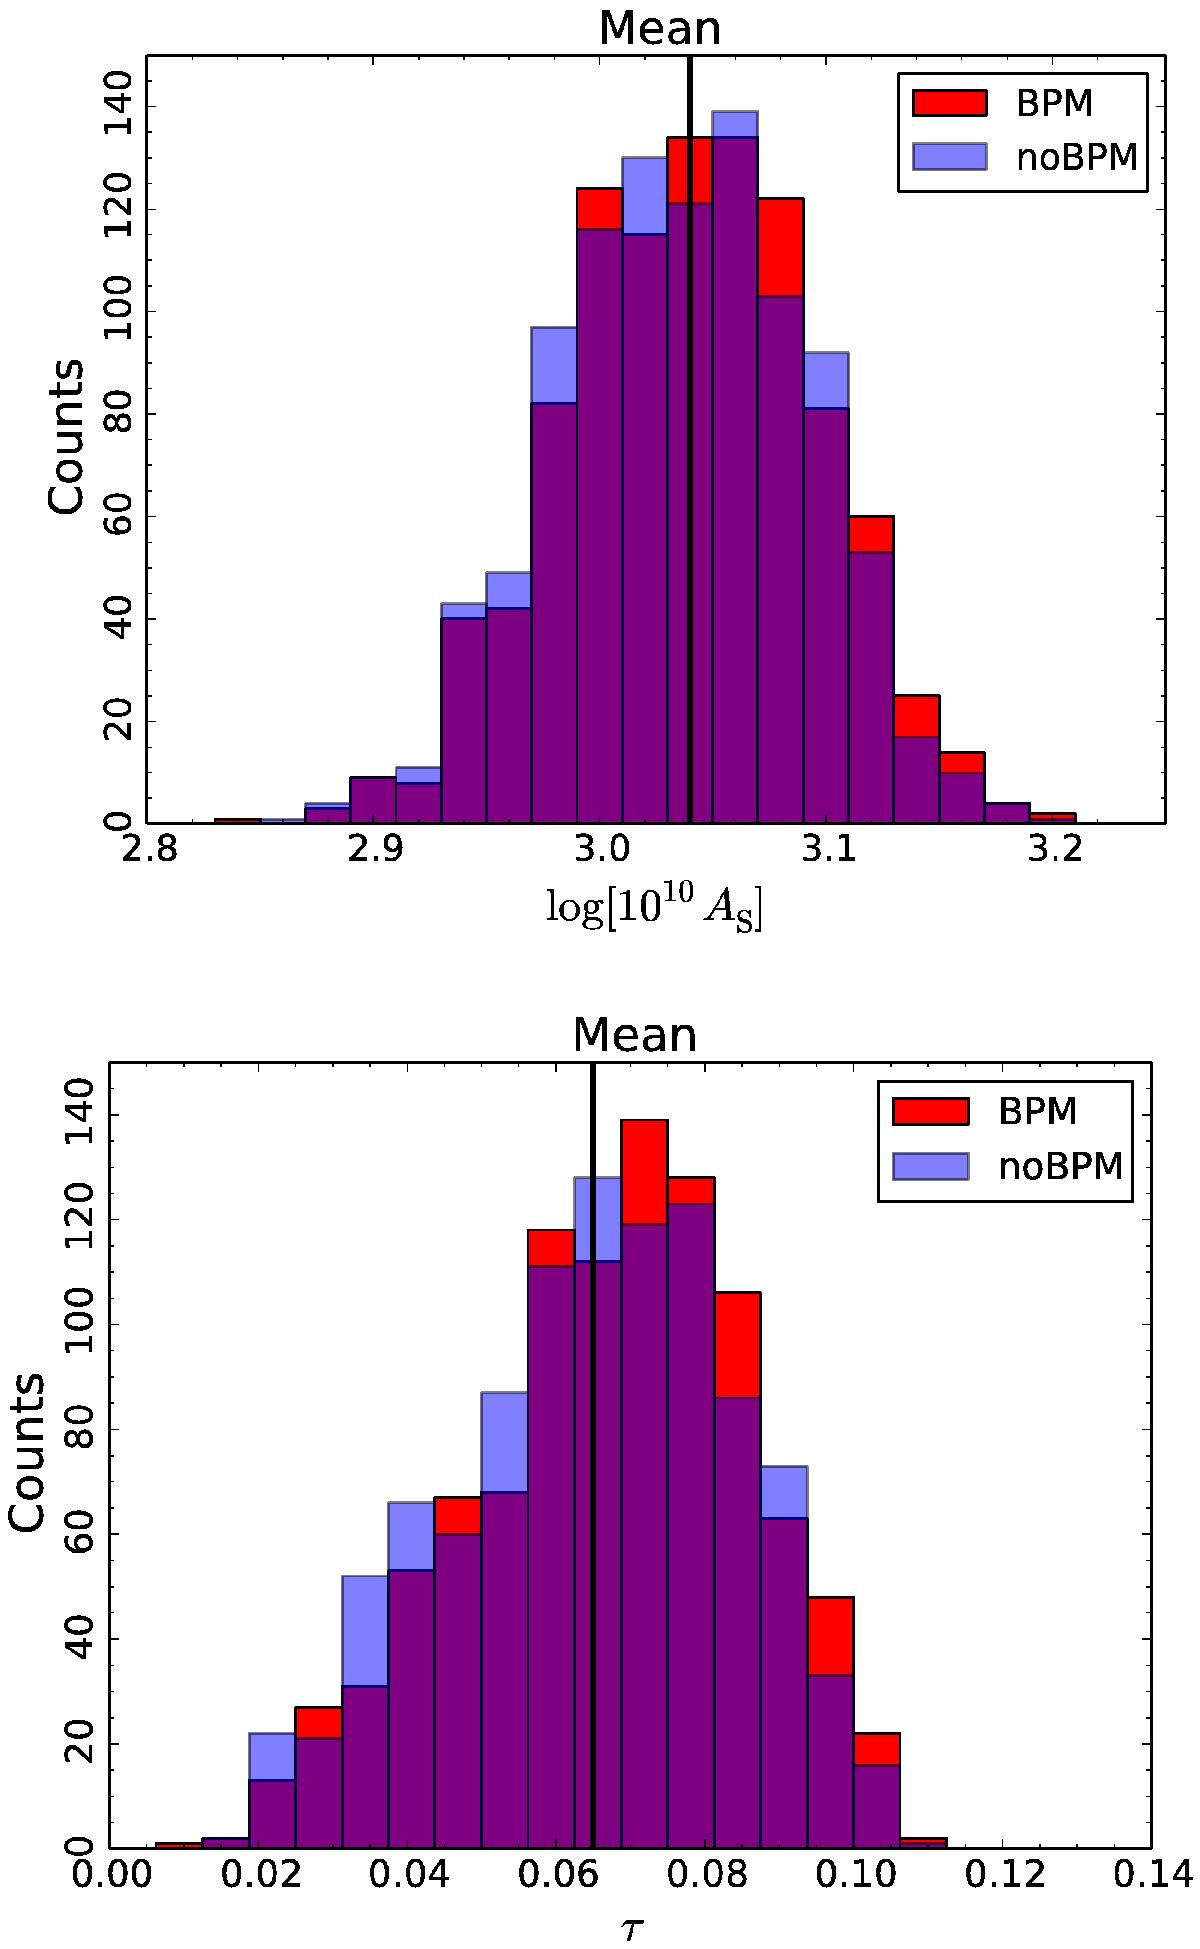
Fig. 9

Empirical distribution of the mean estimated values for log [1010As] (top) and τ (bottom), derived from 1000 FFP8 simulations (see text). For each simulation, we perform a full end-to-end run, including foreground cleaning and parameter estimation. Blue bars refer to simulations that do not include the instrumental bandpass mismatch, while red bars do. The violet bars flag the overlapping area, while the vertical black lines show the input parameters. We note that the (uncorrected) bandpass mismatch effect hardly changes the estimated parameters.
Current usage metrics show cumulative count of Article Views (full-text article views including HTML views, PDF and ePub downloads, according to the available data) and Abstracts Views on Vision4Press platform.
Data correspond to usage on the plateform after 2015. The current usage metrics is available 48-96 hours after online publication and is updated daily on week days.
Initial download of the metrics may take a while.


