Fig. E.4
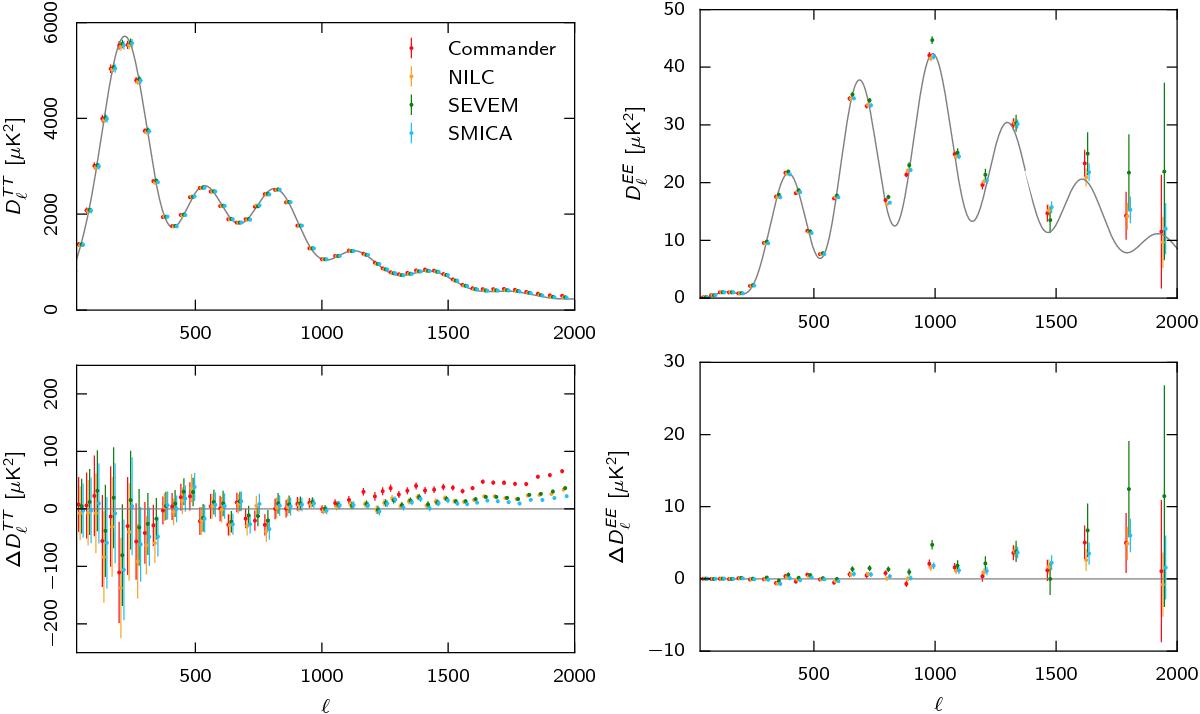
CMB TT (left) and EE (right) power spectra for each of the four foreground-cleaned CMB maps. Upper panels show raw band-powers; the grey lines show the best-fit ΛCDM model from the Planck 2015 likelihood. Lower panels show residual band-powers after subtracting the best-fit ΛCDM model, showing the residual extragalactic foreground contribution.
Current usage metrics show cumulative count of Article Views (full-text article views including HTML views, PDF and ePub downloads, according to the available data) and Abstracts Views on Vision4Press platform.
Data correspond to usage on the plateform after 2015. The current usage metrics is available 48-96 hours after online publication and is updated daily on week days.
Initial download of the metrics may take a while.