Fig. E.2
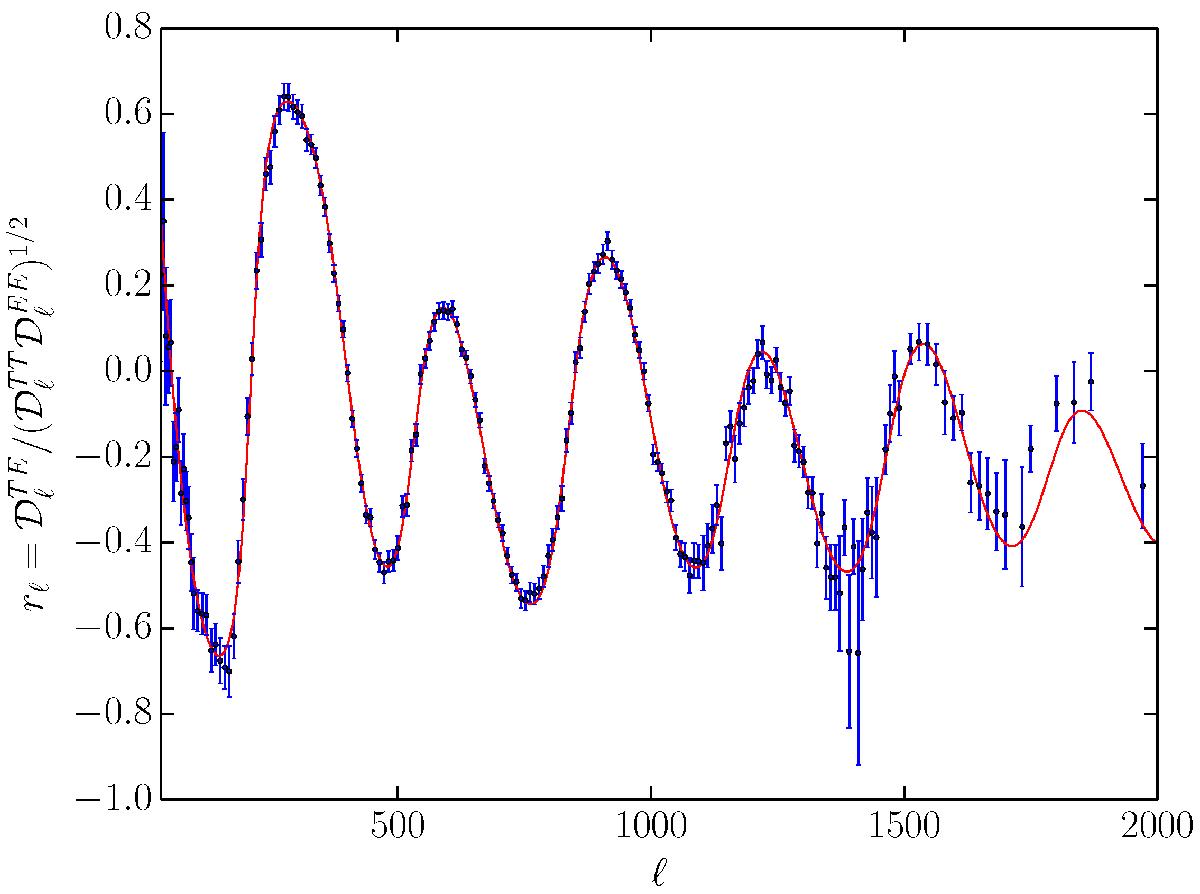
Pearson correlation coefficient for T and E. The red curve is the theoretical best-fit to the PlanckTT, TE, EE+lowP data. The blue points are the binned Planck data described in this paper. Data points with negative values for EE, or low S/N in polarization (specifically S/N< 1) are omitted, which leads to an apparent bias between the theory curve and the data at the highest multipoles. The error bars here are calculated assuming a Gaussian distribution for the TT, TE, and EE power values, which should be a reasonable approximation at high ℓ. The Pearson coefficient is also normally distributed at high ℓ.
Current usage metrics show cumulative count of Article Views (full-text article views including HTML views, PDF and ePub downloads, according to the available data) and Abstracts Views on Vision4Press platform.
Data correspond to usage on the plateform after 2015. The current usage metrics is available 48-96 hours after online publication and is updated daily on week days.
Initial download of the metrics may take a while.