Fig. C.11
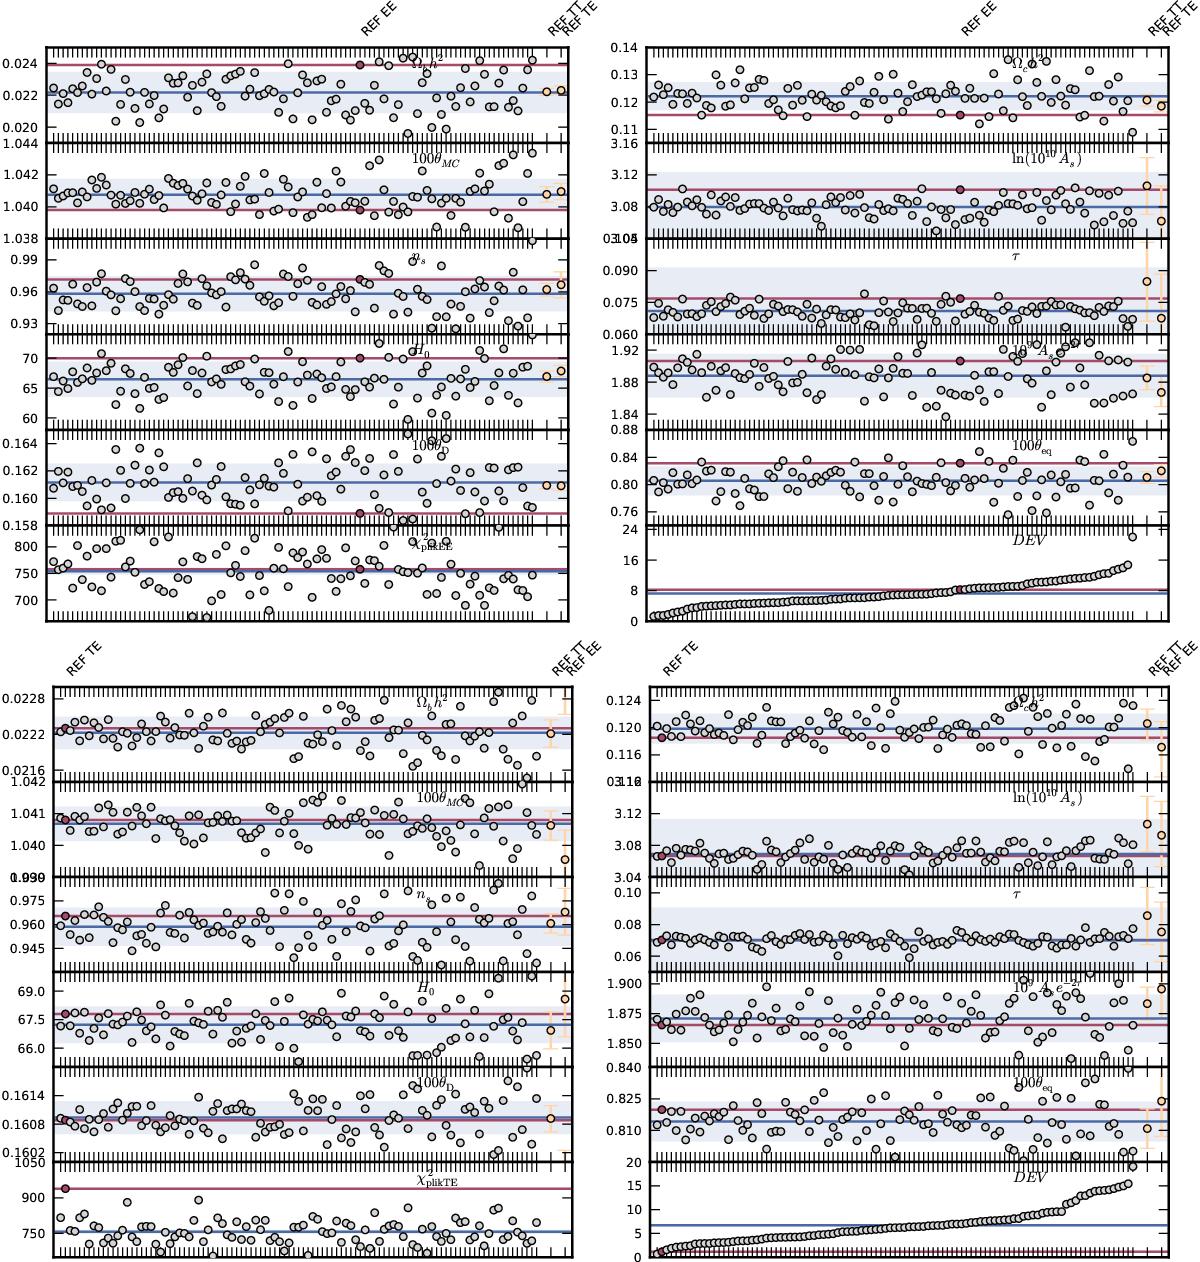
Marginal mean and 68% CL error bars on cosmological parameters estimated from 100 EE (left) or TE (right) power-spectra simulations conditioned on the TT power spectrum, assuming as a fiducial cosmology the best-fit of the ΛCDM Plik TT+tauprior results (grey circles). The blue line shows the mean of the simulations, i.e., the expected cosmology from the conditioned EE (or TE) spectra, while the blue band just shows the 68% CL error bar. The different cases are ordered from the least to the most “deviant” result according to the ![]() parameter defined in Eq. (C.36) and called “DEV” in the plots. The Plik EE+tauprior, Plik TE+tauprior, and Plik TT+tauprior cases (in red or yellow) show the results from the real data. All the results in the EE plots were produced using the CAMB code, while those in the TE plots used the PICO code.
parameter defined in Eq. (C.36) and called “DEV” in the plots. The Plik EE+tauprior, Plik TE+tauprior, and Plik TT+tauprior cases (in red or yellow) show the results from the real data. All the results in the EE plots were produced using the CAMB code, while those in the TE plots used the PICO code.
Current usage metrics show cumulative count of Article Views (full-text article views including HTML views, PDF and ePub downloads, according to the available data) and Abstracts Views on Vision4Press platform.
Data correspond to usage on the plateform after 2015. The current usage metrics is available 48-96 hours after online publication and is updated daily on week days.
Initial download of the metrics may take a while.