Fig. C.10
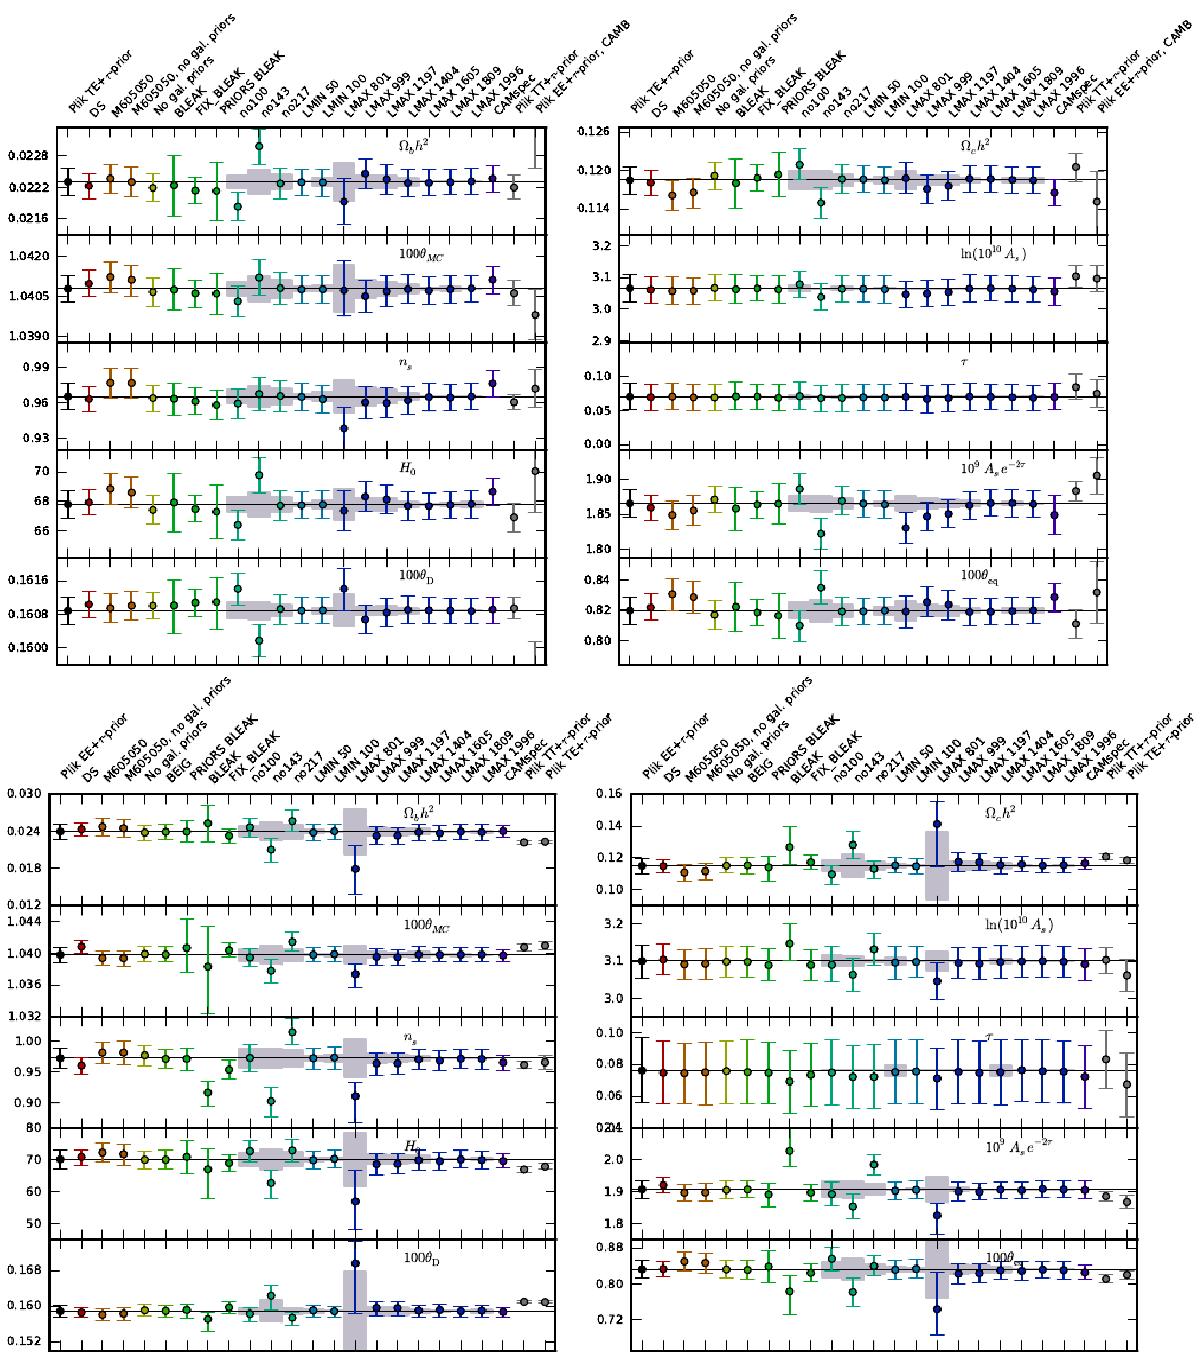
Marginal mean and 68% CL error bars on cosmological parameters estimated adopting different data choices for the Plik likelihood, in comparison with results from alternate approaches or model. Top: TE tests; we assume a ΛCDM model and use the Plik TE+tauprior likelihood in most of the cases, with a prior on τ = 0.07 ± 0.02 (we do not use low-ℓ temperature or polarization data here.). The “Plik TE+tauprior” case (black dot and thin horizontal black line) indicates the baseline (HM, ℓmin = 30, ℓmax = 1996), while the other cases are described in Appendix C.3.5. The grey bands show the standard deviation of the expected parameter shift, for those cases where the data used are a sub-sample of the baseline likelihood (see Eq. (53)). All the cases shown in these TE plots are run with PICO , except for the “Plik EE+tauprior, CAMB ” case, which is run with CAMB (see Appendix C.5 for further details). Bottom: EE tests; the same as the top plots, but for the Plik EE+tauprior likelihood. For these EE plots we used CAMB instead of PICO to run all the cases (including Plik TT+tauprior and Plik TE+tauprior).
Current usage metrics show cumulative count of Article Views (full-text article views including HTML views, PDF and ePub downloads, according to the available data) and Abstracts Views on Vision4Press platform.
Data correspond to usage on the plateform after 2015. The current usage metrics is available 48-96 hours after online publication and is updated daily on week days.
Initial download of the metrics may take a while.