Free Access
Fig. C.5
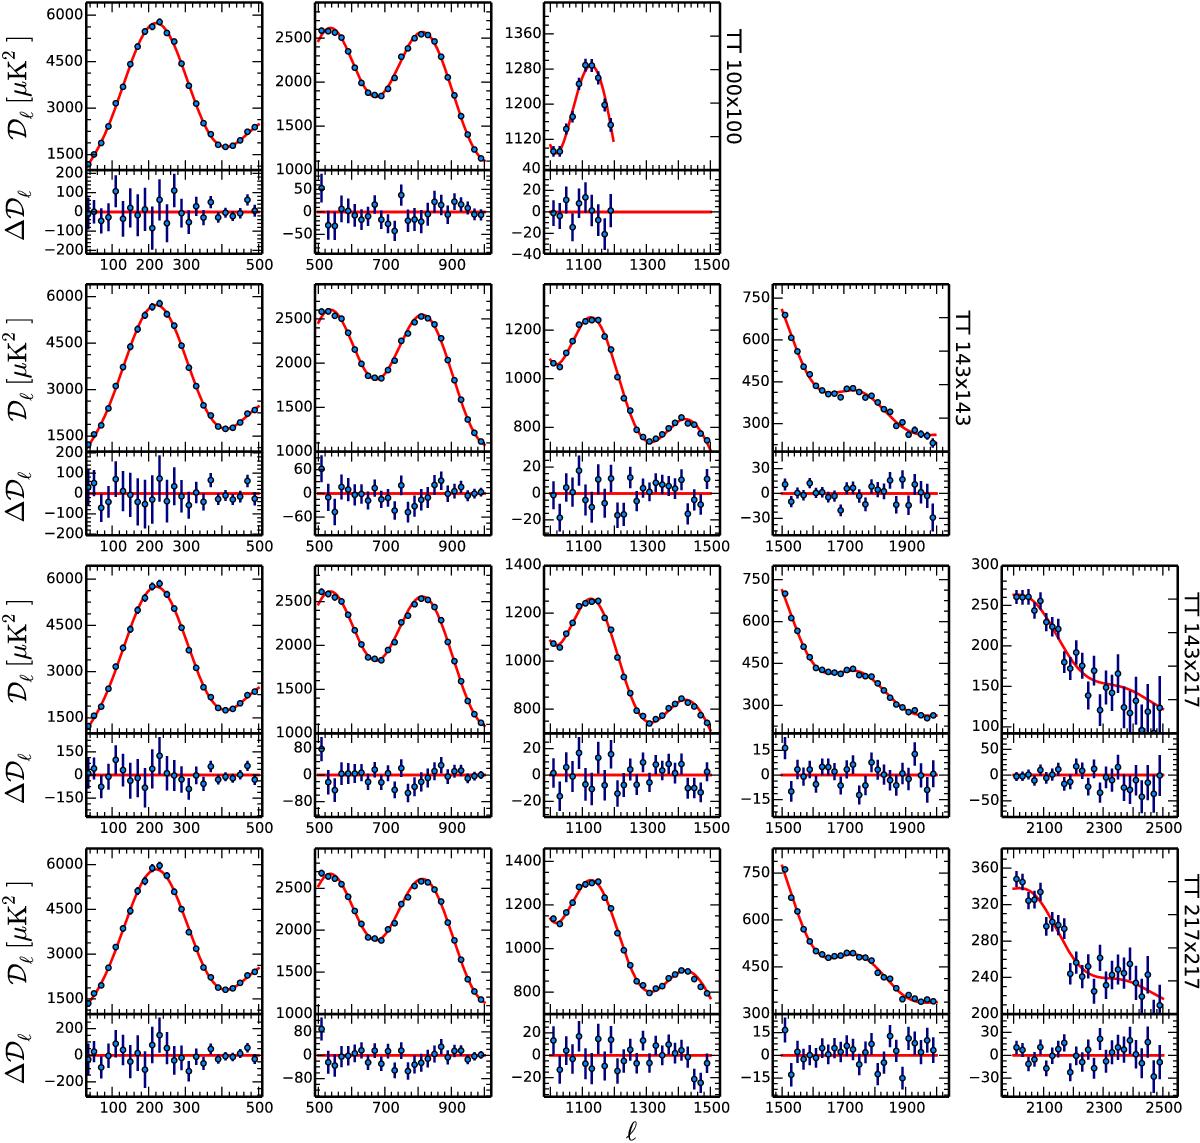
Per-frequency zoomed-in TT power spectra, in Δℓ = 20 bins. The red line shows the Plik TT+tauprior ΛCDM best-fit model. The lower plots show the residuals. We only show the ℓ ranges used in the baseline Plik likelihood.
Current usage metrics show cumulative count of Article Views (full-text article views including HTML views, PDF and ePub downloads, according to the available data) and Abstracts Views on Vision4Press platform.
Data correspond to usage on the plateform after 2015. The current usage metrics is available 48-96 hours after online publication and is updated daily on week days.
Initial download of the metrics may take a while.