Fig. C.3
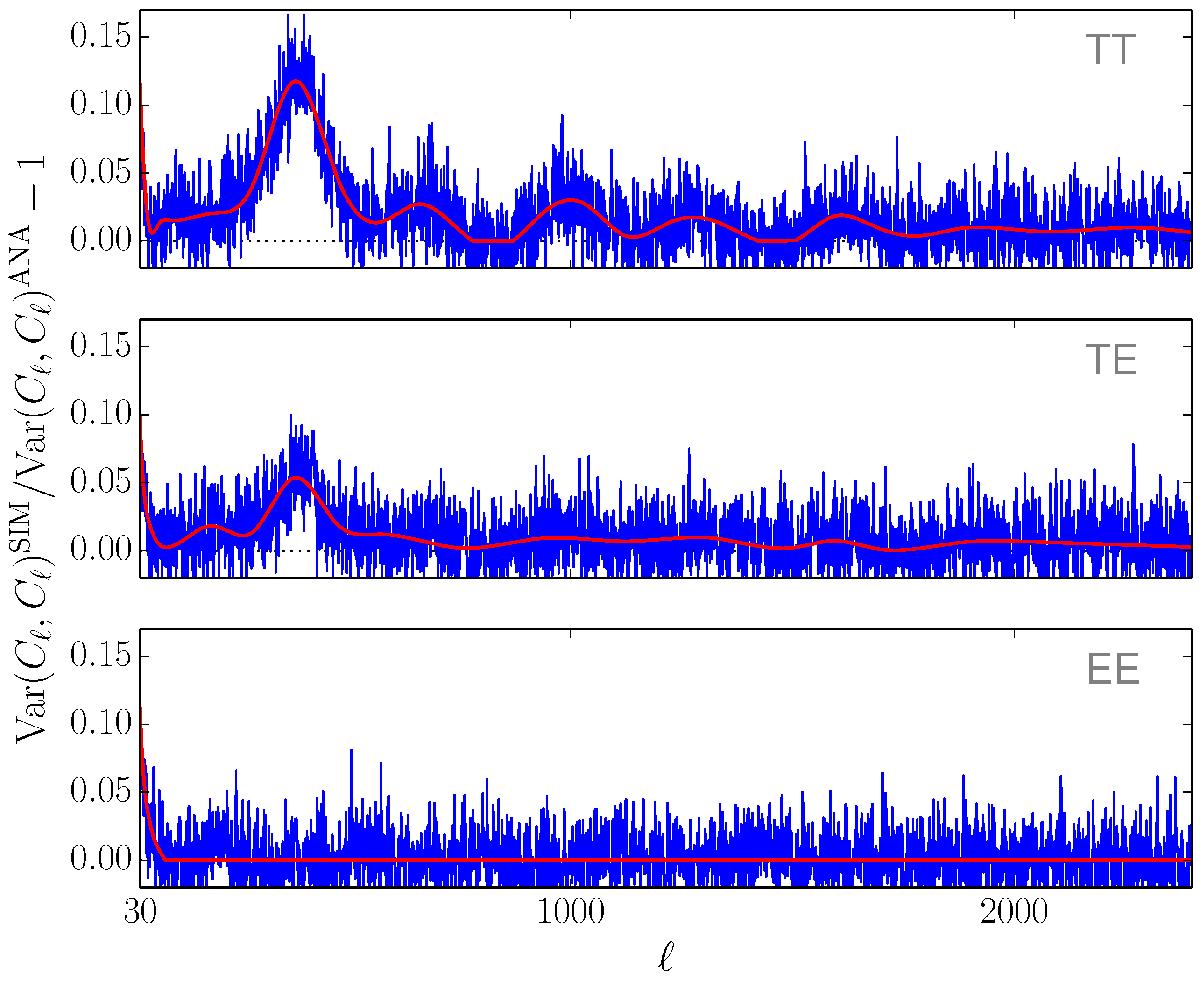
Excess variance induced by the temperature point-source mask. The graphs compare the diagonal elements of the empirical and analytical power spectrum covariance matrices (blue lines) for TT (upper panel), TE (middle panel), and EE (lower panel), and show deviations at the 10% level. The red lines are smooth fits based on cubic splines.
Current usage metrics show cumulative count of Article Views (full-text article views including HTML views, PDF and ePub downloads, according to the available data) and Abstracts Views on Vision4Press platform.
Data correspond to usage on the plateform after 2015. The current usage metrics is available 48-96 hours after online publication and is updated daily on week days.
Initial download of the metrics may take a while.