Fig. 50
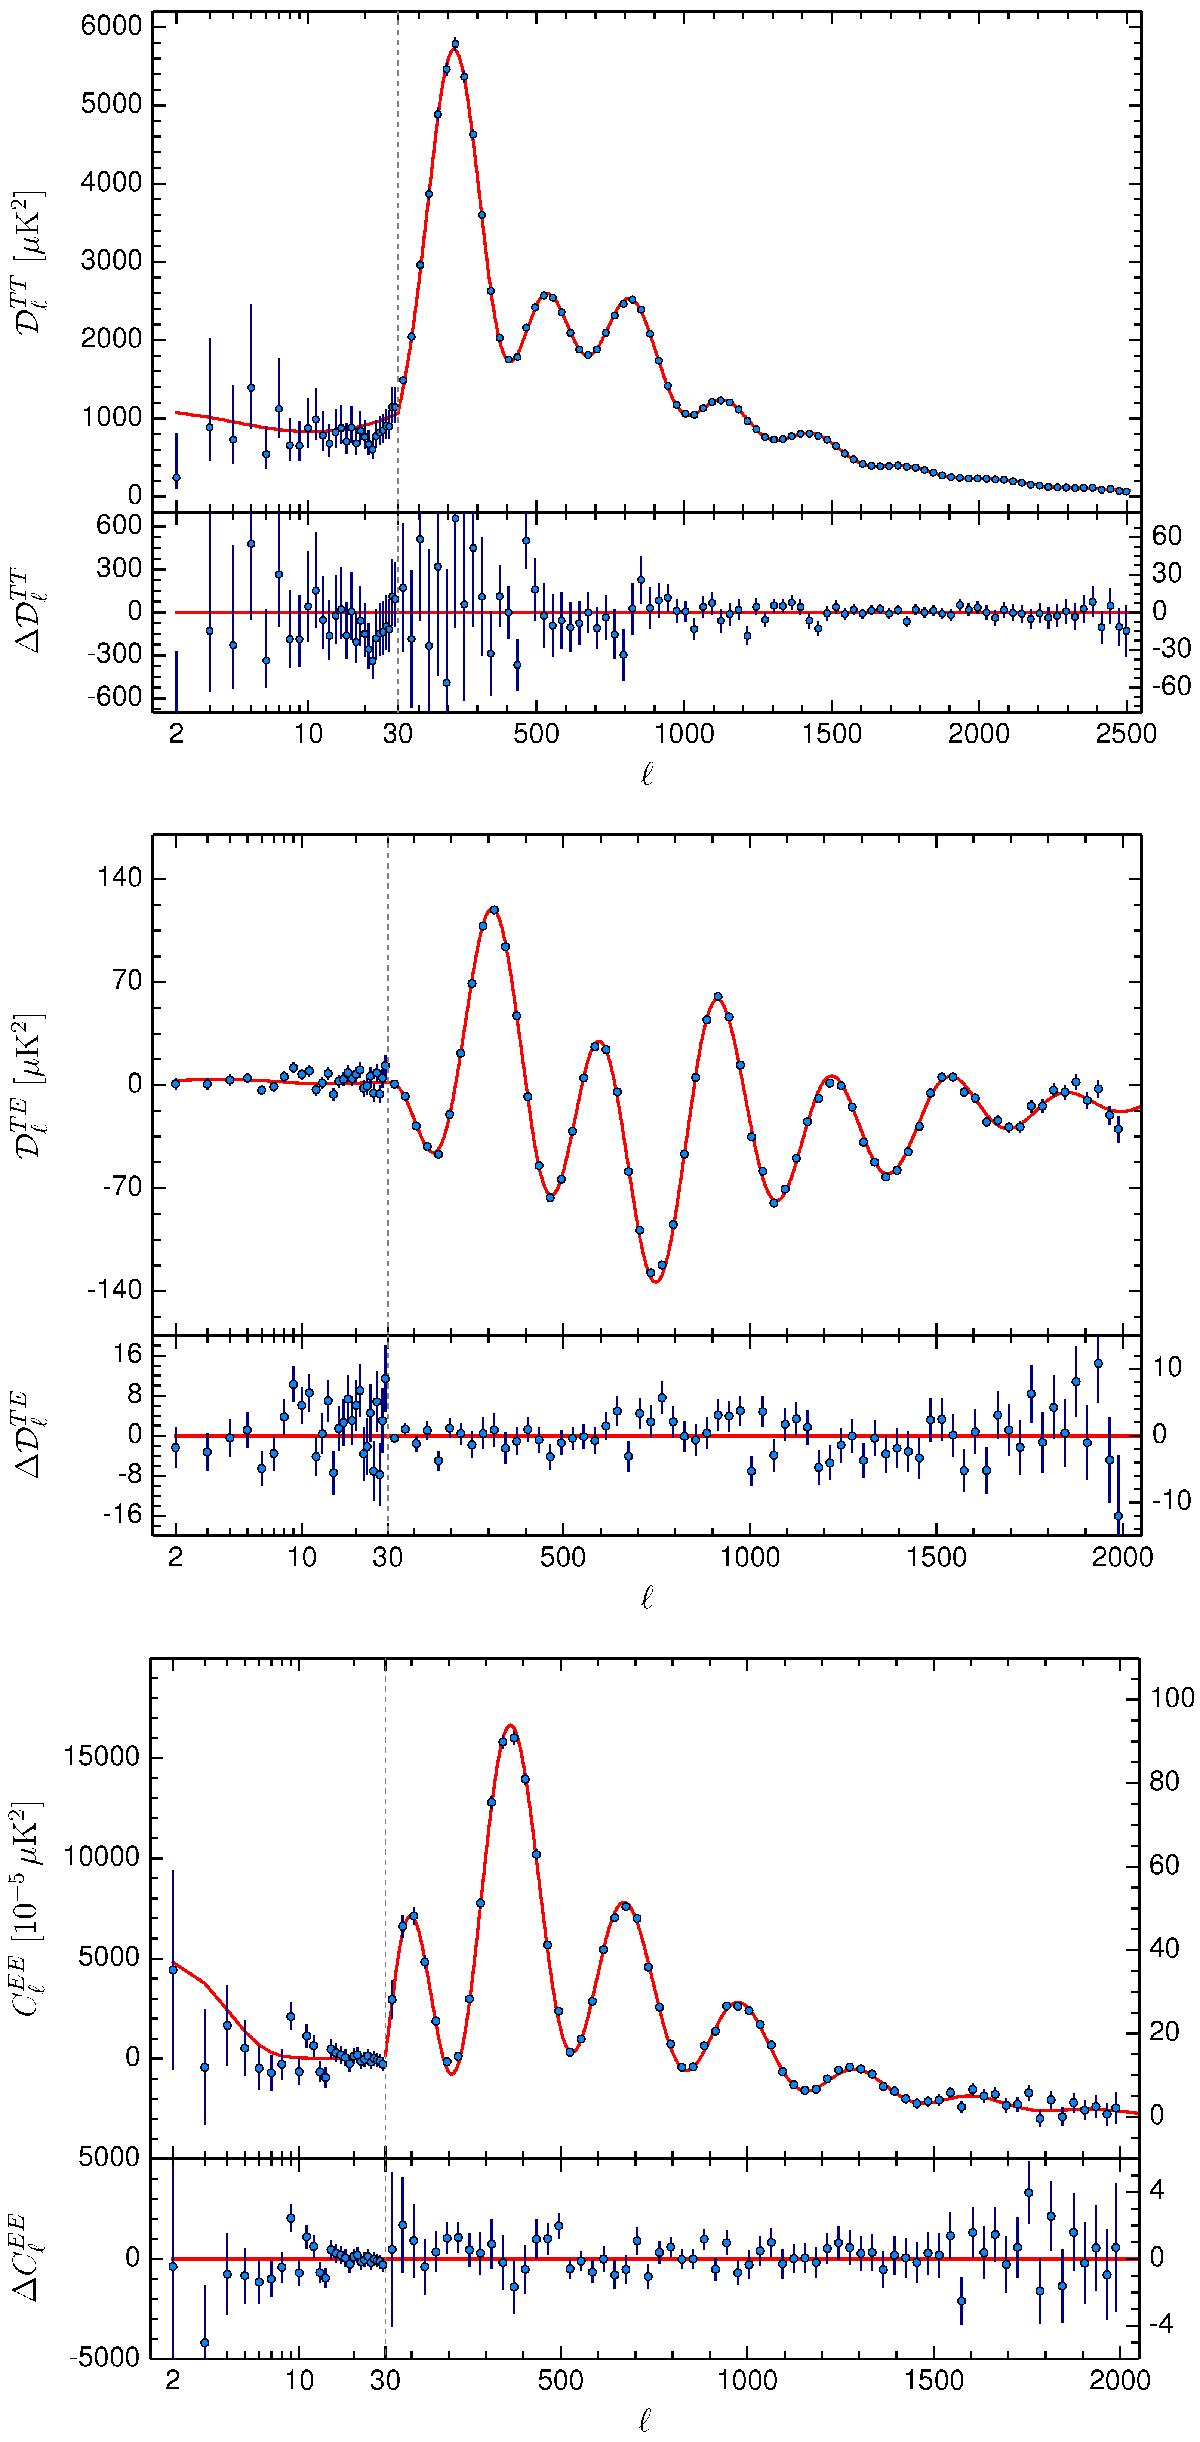
Planck 2015 CMB spectra, compared with the base ΛCDM fit to PlanckTT+lowP data (red line). The upper panels show the spectra and the lower panels the residuals. In all the panels, the horizontal scale changes from logarithmic to linear at the “hybridization” scale, ℓ = 29 (the division between the low-ℓ and high-ℓ likelihoods). For the residuals, the vertical axis scale changes as well, as shown by different left and right axes. We show ![]() for TT and TE, but Cℓ for EE, which also has different vertical scales at low- and high-ℓ.
for TT and TE, but Cℓ for EE, which also has different vertical scales at low- and high-ℓ.
Current usage metrics show cumulative count of Article Views (full-text article views including HTML views, PDF and ePub downloads, according to the available data) and Abstracts Views on Vision4Press platform.
Data correspond to usage on the plateform after 2015. The current usage metrics is available 48-96 hours after online publication and is updated daily on week days.
Initial download of the metrics may take a while.