Free Access
Fig. 5
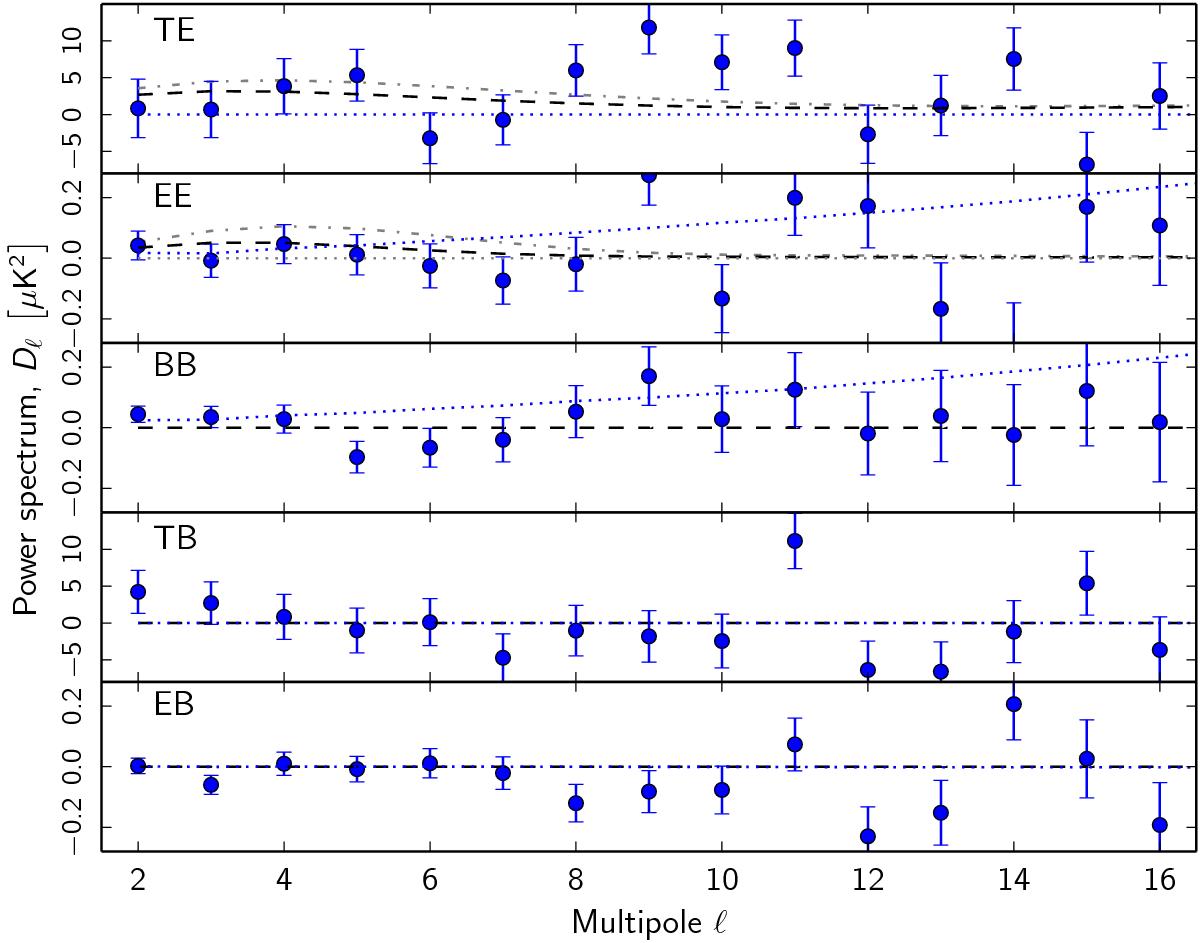
Polarized QML spectra from foreground-cleaned maps. Shown are the 2013 Planck best-fit model (τ = 0.089, dot-dashed) and the 2015 model (τ = 0.067, dashed), as well as the 70 GHz noise bias computed from Eq. (11) (blue dotted).
Current usage metrics show cumulative count of Article Views (full-text article views including HTML views, PDF and ePub downloads, according to the available data) and Abstracts Views on Vision4Press platform.
Data correspond to usage on the plateform after 2015. The current usage metrics is available 48-96 hours after online publication and is updated daily on week days.
Initial download of the metrics may take a while.