Fig. 49
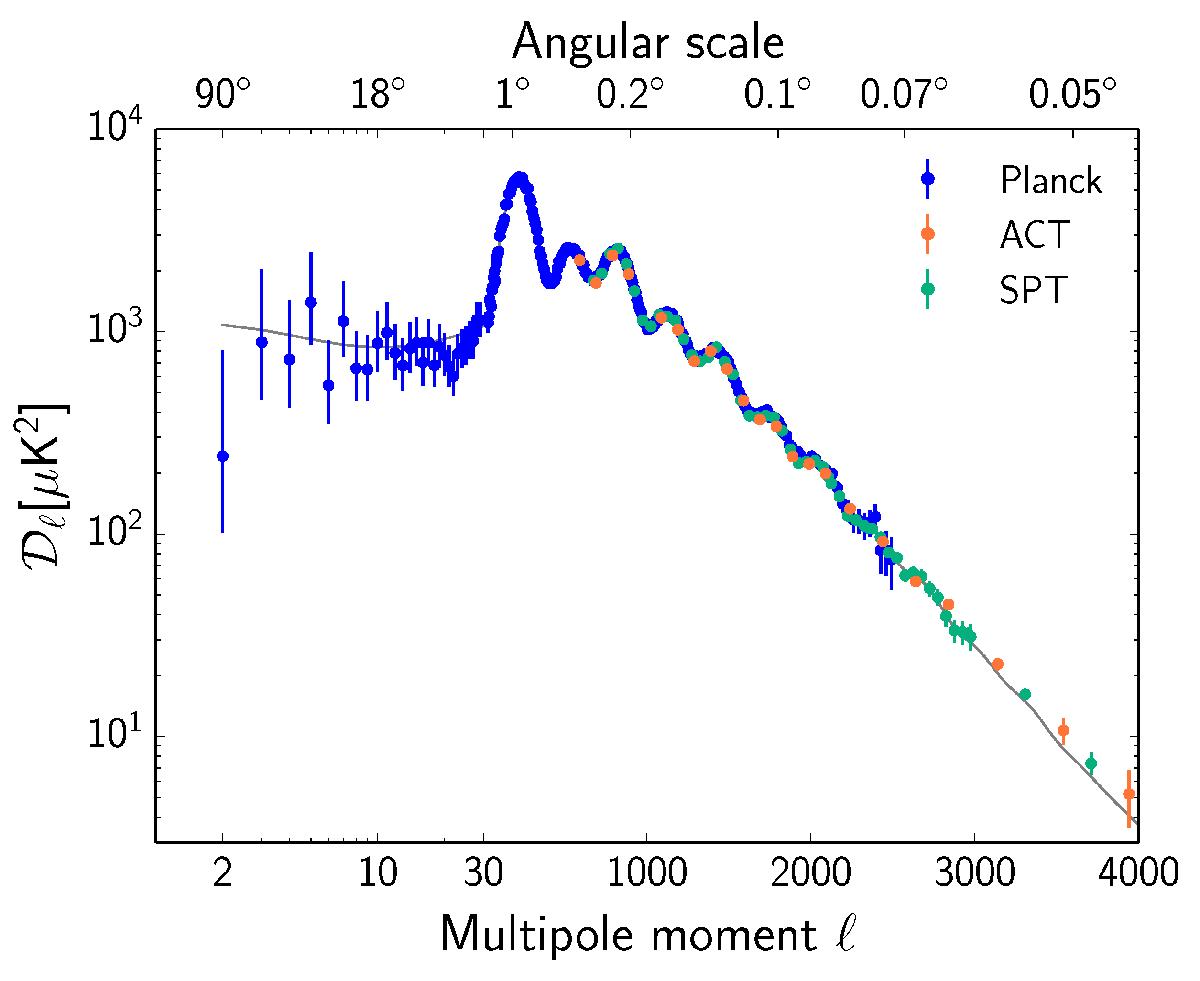
CMB-only power spectra measured by Planck (blue), ACT (orange), and SPT (green). The best-fit PlanckTT+lowP ΛCDM model is shown by the grey solid line. ACT data at ℓ> 1000 and SPT data at ℓ> 2000 are marginalized CMB band-powers from multi-frequency spectra presented in Das et al. (2014) and George et al. (2015) as extracted in this work. Lower multipole ACT (500 <ℓ< 1000) and SPT (650 <ℓ< 3000) CMB power extracted by Calabrese et al. (2013) from multi-frequency spectra presented in Das et al. (2014) and Story et al. (2013) are also shown. The binned values in the range 3000 <ℓ< 4000 appear higher than the unbinned best-fit line because of the binning (this is numerically confirmed by the residual plot in Planck Collaboration XIII 2016, Fig. 9).
Current usage metrics show cumulative count of Article Views (full-text article views including HTML views, PDF and ePub downloads, according to the available data) and Abstracts Views on Vision4Press platform.
Data correspond to usage on the plateform after 2015. The current usage metrics is available 48-96 hours after online publication and is updated daily on week days.
Initial download of the metrics may take a while.