Fig. 48
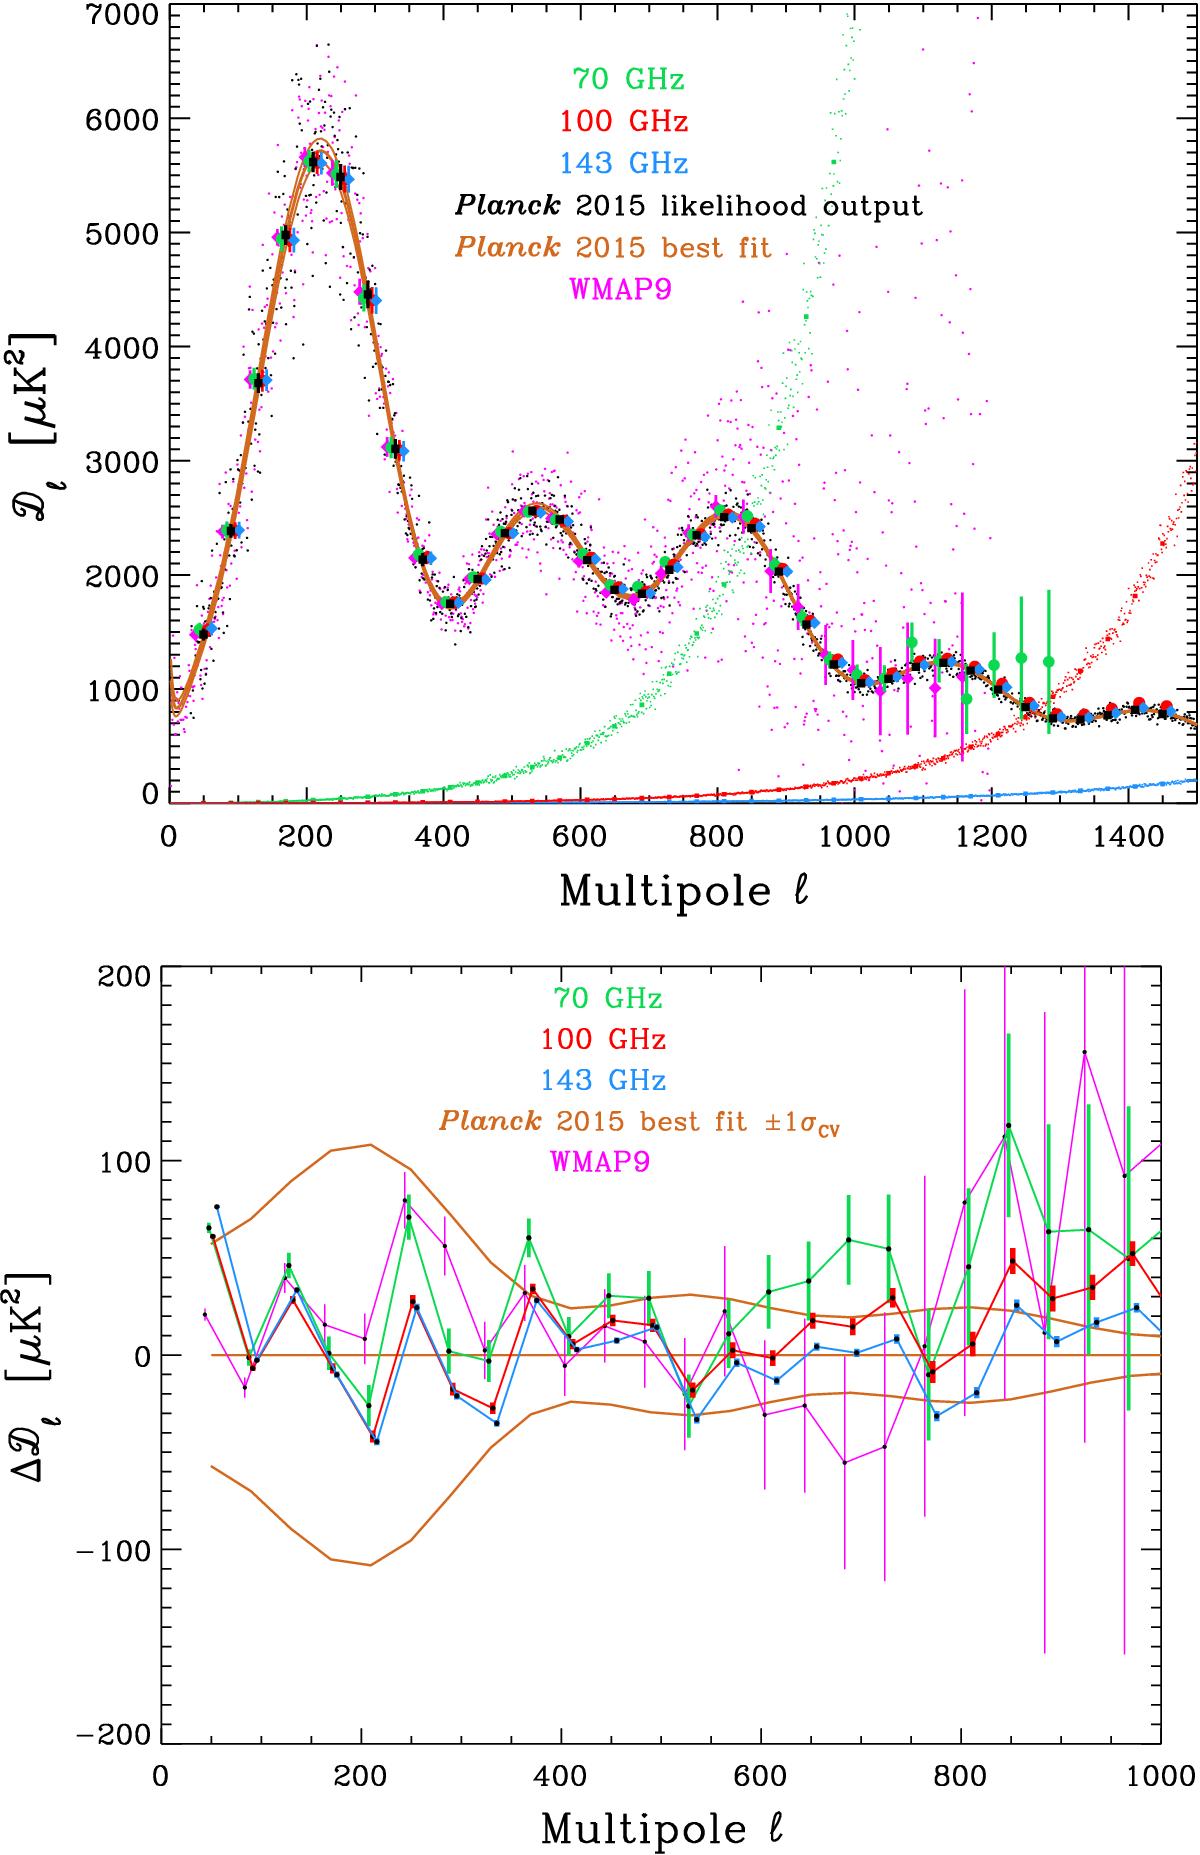
Comparison of Planck and WMAP-9 CMB power spectra. Top: direct comparison. Noise spectra are derived from the half-ring difference maps. Bottom: residuals with respect to the PlanckΛCDM best-fit model. The error bars do not include the cosmic variance contribution (but the (brown) 1σ contour lines for the Likelihood best fit model do).
Current usage metrics show cumulative count of Article Views (full-text article views including HTML views, PDF and ePub downloads, according to the available data) and Abstracts Views on Vision4Press platform.
Data correspond to usage on the plateform after 2015. The current usage metrics is available 48-96 hours after online publication and is updated daily on week days.
Initial download of the metrics may take a while.